While most users are familiar with the main DymaxIO®/Diskeeper®/V-locity®/SSDkeeper® Dashboard view which focuses on the number of I/Os eliminated and Storage I/O Time Saved, the I/O Performance Dashboard tab takes a deeper look into the performance characteristics of I/O activity. The data shown here is similar in nature to other Windows performance monitoring utilities and provides a wealth of data on I/O traffic streams.
Viewing Your Data
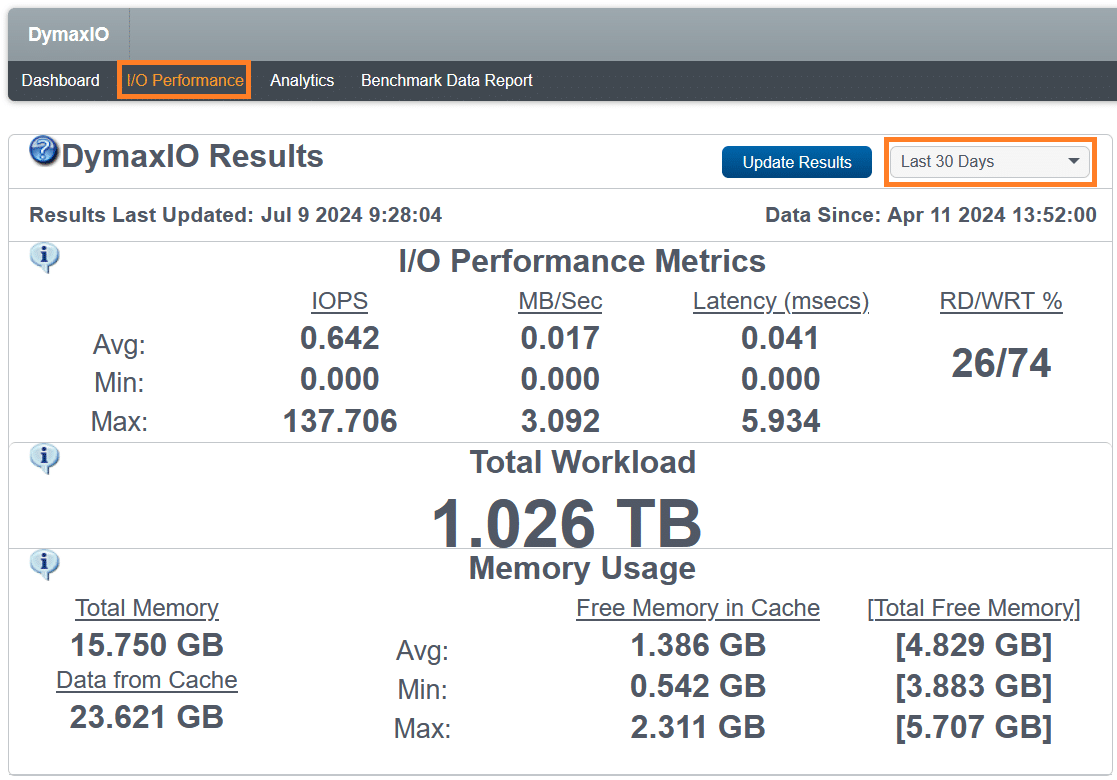
Open DymaxIO (purchase or free trial) and click on the I/O Performance tab. By default, the information displayed is from the time the product was installed. You can easily filter this down to a different time frame by clicking on the “Since Installation” picklist and choosing a different time frame such as Last 24 Hours, Last 7 Days, Last 30 Days, Last 60 Days, Last 90 Days, or Last 180 Days. The data displayed will automatically be updated to reflect the time frame selected.
I/O Performance Metrics
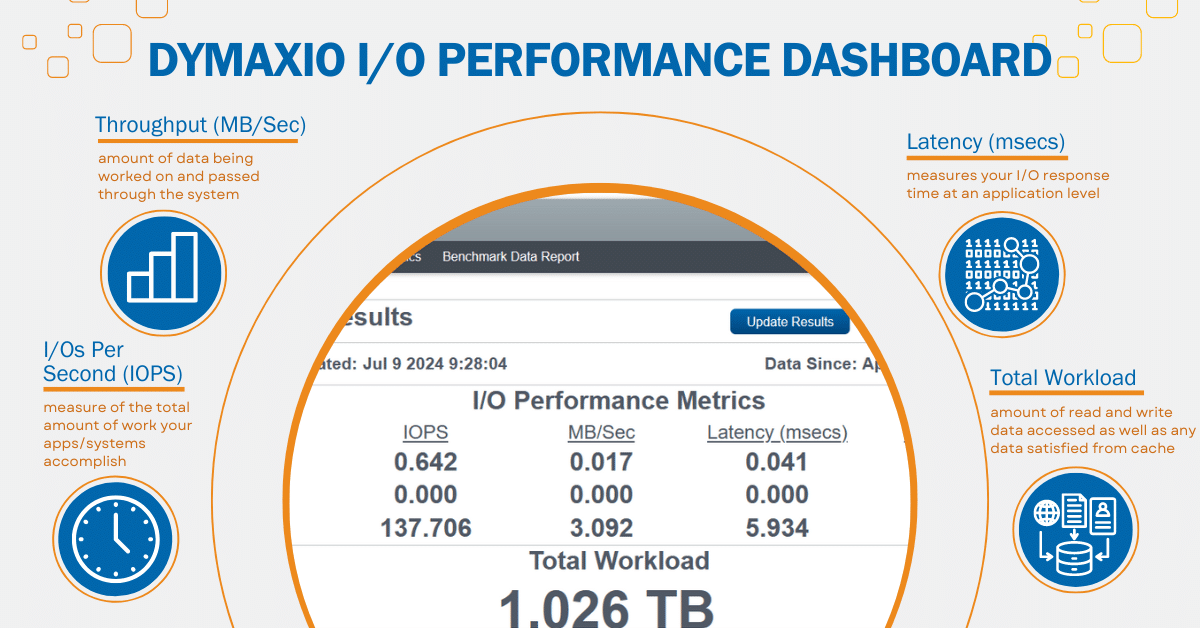
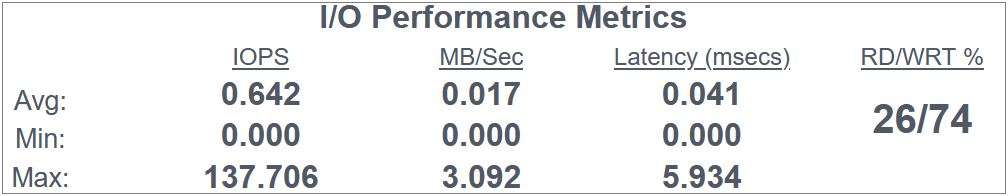
The first section of the display above is labeled as “I/O Performance Metrics” and you will see values that represent Average, Minimum, and Maximum values for I/Os Per Second (IOPS), throughput measured in Megabytes per Second (MB/Sec) and application I/O Latency measured in milliseconds (msecs). DymaxIO, Diskeeper, V-locity and SSDkeeper use the Windows high performance system counters to gather this data and it is measured down to the microsecond (1/1,000,000 second).
While most people are familiar with IOPS and throughput expressed in MB/Sec, I will give a short description just to review.
IOPS is the number of I/Os completed in 1 second of time.This is a measurement of both read and write I/O operations.MB/Sec is a measurement that reflects the amount of data being worked on and passed through the system.Taken together they represent speed and throughput efficiency.
Latency: Accurately Measuring I/O Response Time
The Latency value shown in the above report is not measured at the storage device, but instead is a much more accurate reflection of I/O response time at an application level. This is where the rubber meets the road. Each I/O that passes through the Windows storage driver has a start and completion time stamp. The difference between these two values measures the real-world elapsed time for how long it takes an I/O to complete and be handed back to the application for further processing.
Measurements at the storage device do not account for network, host, and hypervisor congestion. Therefore, our Latency value is a much more meaningful value than typical hardware counters for I/O response time or latency.
In this display, we also provide meaningful data on the percentage of I/O traffic: which are reads and which are writes. This helps to better gauge which of our technologies (IntelliMemory® or IntelliWrite®) is likely to provide the greatest benefit.
Total Workload
The next section of the display measures the “Total Workload” in terms of the amount of data accessed for both reads and writes as well as any data satisfied from cache.

A system which has higher workloads as compared to other systems in your environment are the ones that likely have higher I/O traffic and tend to cause more of the I/O blender effect when connected to a shared SAN storage, virtualized, and/or cloud environment and are prime candidates for the extra I/O capacity relief that DymaxIO provides.
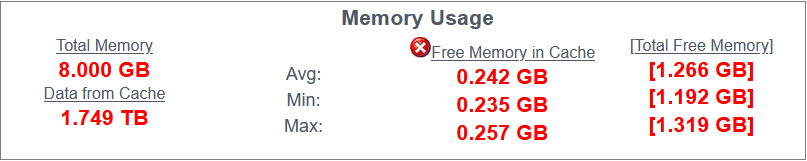
Memory Usage
Moving into the third section of the display labeled as “Memory Usage” we see some measurements that represent the Total Memory in the system and the total amount of I/O data that has been satisfied from the IntelliMemory cache. The purpose of our patented read caching technology is twofold:
- Satisfy from cache the frequently repetitive read data requests.
- Be aware of the small read operations that tend to cause excessive “noise” in the I/O stream to storage and satisfy them from the cache.
So, it’s not uncommon to see the “Data Satisfied from Cache” compared to the “Total Workload” to be a bit lower than other types of caching algorithms. Storage arrays tend to do quite well when handed large sequential I/O traffic but choke when small random reads and writes are part of the mix.
Eliminating I/O traffic from going to storage is what it’s all about. The fewer I/Os to storage, the faster and more data your applications will be able to access.
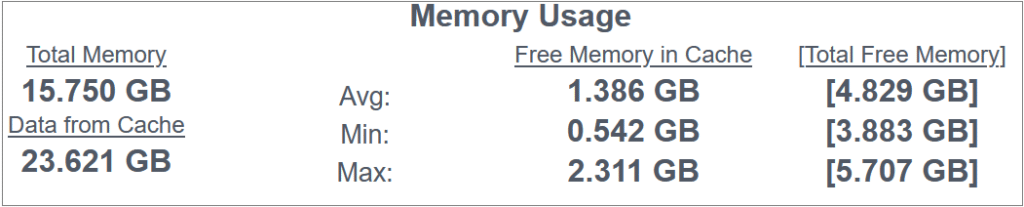
In addition, we show the average, minimum, and maximum values for free memory used by the cache. For each of these values, the corresponding Total Free Memory in Cache for the system is shown (Total Free Memory is memory used by the cache plus memory reported by the system as free). The memory values will be displayed in a yellow color font if the size of the cache is being severely restricted due to the current memory demands of other applications and preventing our product from providing maximum I/O benefit. The memory values will be displayed in red if the Total Available Memory is less than 3GB.
Read I/O traffic, which is potentially cacheable, can receive an additional benefit by adding more DRAM for the cache and allowing the IntelliMemory caching technology to satisfy a greater amount of that read I/O traffic at the speed of DRAM (10-15 times faster than SSD), offloading it away from the slower back-end storage. This would have the effect of further reducing average storage I/O latency and saving even more storage I/O time.
Additional Note for machines running SQL Server or Microsoft Exchange: You will likely need to cap the amount of memory that those applications can use (if you haven’t done so already), to prevent them from ‘stealing’ any additional memory that you add to those machines.
IntelliMemory Read Cache is Dynamic and Self-Learning
IntelliMemory read cache is dynamic and self-learning! This means you do not need to pre-allocate a fixed amount of memory to the cache or run some pre-assessment tool or discovery utility to determine what should be loaded into cache. IntelliMemory will only use memory that is otherwise, free, available, or unused memory for its cache and will always leave plenty of memory untouched (1.5GB – 4GB depending on the total system memory) and available for Windows and other applications to use. As there is a demand for memory, IntelliMemory will release memory from it’s cache and give this memory back to Windows so there will not be a memory shortage. There is further intelligence with the IntelliMemory caching technology to know in real time precisely what data should be in cache at any moment in time and the relative importance of the entries already in the cache. The goal is to ensure that the data maintained in the cache results in the maximum benefit possible to reduce Read I/O traffic.
Conclusion
The I/O Performance tab in DymaxIO’s Dashboard offers a detailed view of I/O activity, providing metrics like IOPS, throughput, and latency. By measuring application-level latency, it ensures an accurate reflection of real-world I/O response times.
The Total Workload and Memory Usage sections demonstrate the benefits of IntelliMemory caching technology, which offloads repetitive and small read operations to the cache, reducing strain on storage devices and enhancing application performance. The dynamic, self-learning nature of IntelliMemory optimizes cache usage in real time.
In summary, the I/O Performance Dashboard illuminates the benefits and inner workings of DymaxIO in terms of I/O performance and memory management, making it an essential tool for enhancing system efficiency and responsiveness.
Click here to get started with DymaxIO »
Howard Butler, Senior Director Field Engineering
Originally published on: Aug 2, 2018. Last update July 9, 2024.


Jbrenner,
We are happy you are enjoying the blog! We plan to continue to give you great posts like this one.
Condusiv
[email protected]
Thanks for reading! Glad you enjoyed it.
Condusiv
I conceive you have mentioned some very interesting points , thanks for the post.
Hi, Neat post. There is a problem along with your site in internet explorer, would test this… IE still is the market leader and a big element of other folks will miss your wonderful writing because of this problem.
C:Program FilesCondusiv TechnologiesDiskeeperDkcTelemetryFileIOTypeDataFileIOTypeData.dat 311MB
C:Program FilesCondusiv TechnologiesDiskeeperDkcTelemetryProcessStatsProcessStats.dat 122MB
These two Diskeeper telemetry log files' sizes are quite big, is there any way to configure Diskeeper to limit the file size or even prevent them from it being constantly updated/modified(log data written to the SSD)? If I use Diskeeper on a daily basis, I find these two files are always modified and the file sizes are getting bigger, base on the fact that the logical disk C is on a solid state drive, the wear leveling and garbage collection cause data to be rewritten on the SSD(write amplification of SSD NAND Flash memory), how to reduce or even eliminate Diskeeper's telemetry log host writes to the SSD? Thank you in advance.
I appreciate the detail in this article. Well written and too the point!
I noticed on a DELL M6700 workstation with 32GB DRAM that Photoshop and Lightroom, who may both use up to 20GB of DRAM, reproducibly fail to complete editing operations on large image files when SSDKeeper dynamic memory caching is enabled. When it is turned off, the problem no longer shows. Any idea why ?