Get More I/Os Per Second From Your NVMe, Flash, or SSD Storage
See side-by-side tests on an NVMe SSD with and without Condusiv’s software for even faster NVM storage. Check it out!
The tests showed beyond doubt that with Condusiv’s software installed, your Windows computer has the ability to process significantly more I/Os per Second, process a much higher throughput of data, and allow the storage I/O-heavy workloads running in computers the opportunity to get significantly more work done in the same amount of time – even when using very fast flash storage.
What value is there to reducing storage I/O traffic?
The more you can reduce storage I/O traffic that has to go out and be processed by your disk storage, the more storage I/O headroom you are handing back to your environment for use by additional workloads. It means that your current disk storage can now cope with:
- More computers sharing the storage. Great if you have a Storage Area Network (SAN) underpinning your virtualized environment, for example. More VMs running!
- More users accessing and manipulating the shared storage. The more users you have, the more storage I/O traffic is likely to be generated.
- Greater CPU utilization. CPU speeds and processing capacity keeps increasing. Now that the processing power is typically much more than typical needs, V-locity can help your applications become more productive and use more of that processing power by not having to wait so much on the disk storage layer.
- If you can achieve this without having to replace or upgrade your storage hardware, it not only increases the return on your current storage hardware investment, but also might allow you to keep that storage running for a longer period of time (if you’re not on a fixed refresh cycle).
It’s easy! Try DymaxIO for faster NVMe storage for yourself for free – no obligation.
More I/Os per Second
DymaxIO’s DRAM read caching engine establishes a tier-0 cache strategy to serve hot reads from idle, available DRAM that is otherwise unused for blazing performance.
Massive Performance Improvements
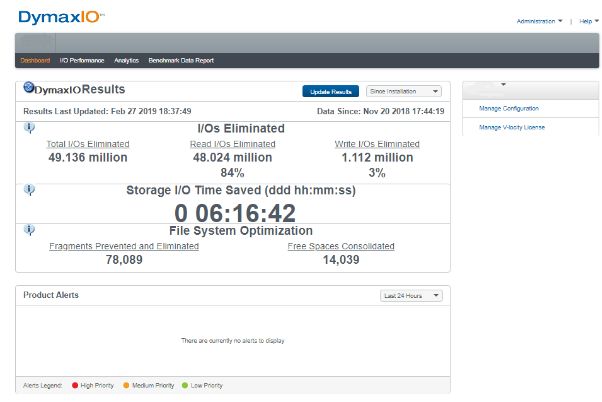
Dashboard shows number of hours that DymaxIO saved in I/O time across any time period.
See Your Whole Environment
See your systems ranked across multiple, key performance metrics.

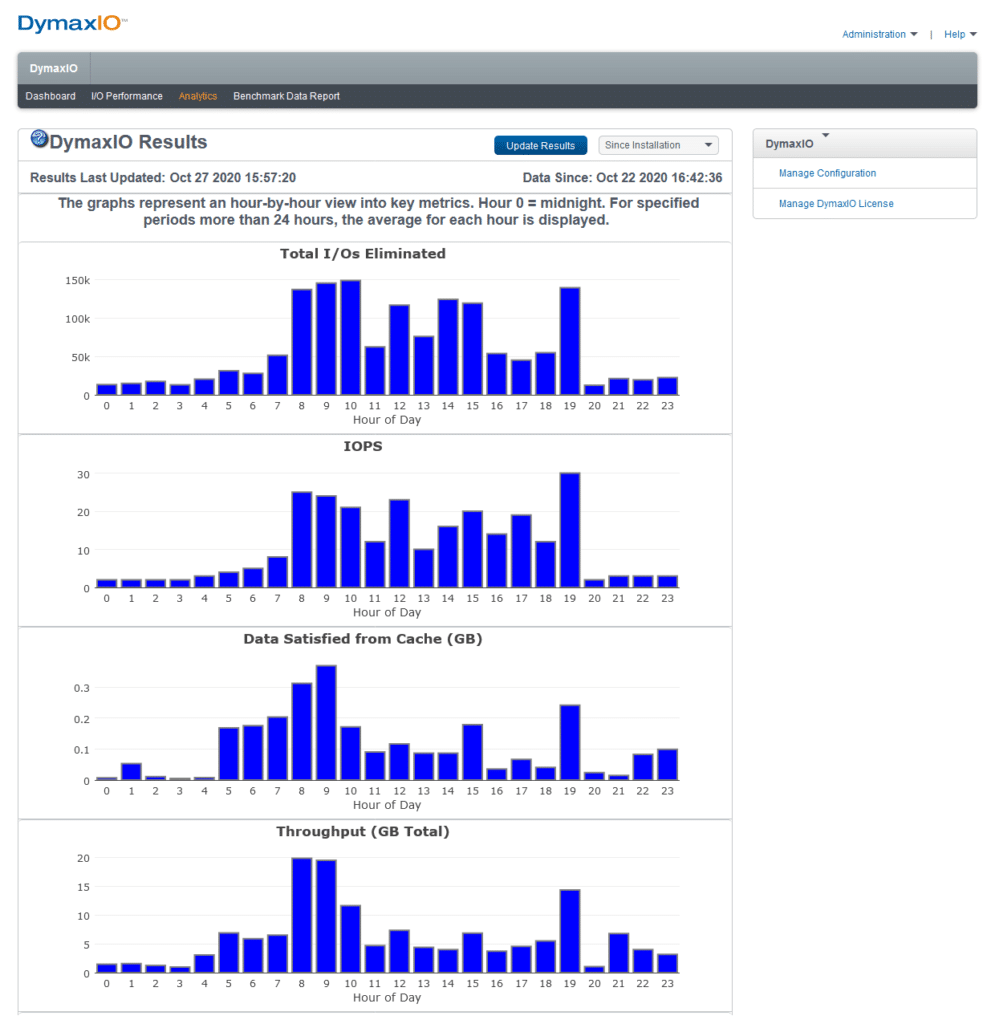
Detailed Analytics
The graphs analytics represent an hour-by-hour view into 13 key metrics.
[transcript]
00:02 Spencer Allingham: Hello everyone. My name is Spencer Allingham, Technical Director at Condusiv. I was asked recently, actually by a couple of customers, if the V-locity and Diskeeper [and DymaxIO] software is still relevant, if they start using all-flash arrays or SSD, really, today’s faster storage. Is there still a place for V-locity and Diskeeper [and DymaxIO]? Now, the short answer to that, of course, is yes, and I would say that I work for the company. But today, in this video, I would actually like to prove it one way or another, and then you can decide for yourself whether the software is relevant. For those of you who don’t know, V-locity and Diskeeper [and DymaxIO] are both designed to significantly reduce the amount of storage I/O traffic that the underlying storage in your compute environments have to deal with. Now, why would you do that?
00:56 SA: Well, it has a very beneficial effect both on performance and the number of workloads that you can host above that same shared storage. So for example, let’s say you’ve got a virtualized environment. So you’re running Hyper-V or VMware, or other, some other type of hypervisor. And at the back end, you might have a storage area network or SAN, or you might have direct attached disk in the physical host. That storage is pretty much always gonna be the slowest part of the estate. If you compare the speed at which things can happen down at the storage layer to the speed at which things happen at a processor layer or in-service like DRAM, those latter two are always gonna be the faster for operations and the transactions that you’re doing. So the more you can reduce the amount of work that that slower back-end storage has to deal with, the better, the faster, the more performance, all of those workloads and applications that you’re running along the top are going to be.
01:52 SA: So the other benefit, other than just performance is that by reducing the amount of storage I/O traffic, I/O is input-output, it’s the transfer of data between the Windows operating system and the back-end storage, in this case anyway. The more you can reduce those I/O operations, the more bandwidth you have in that network pipe between server and storage and the more room you have in that pipe, the more machines you can host over that storage, the more workloads you can run, the more instances of SQL Server or SharePoint or file and print service. You can basically host more machines over that same shared storage than you otherwise would be able to do. And that can only be a good thing for the return on the investment that you’ve made in that storage, especially if it’s expensive storage. So going… I’m going a bit of topic. So I was asked recently by a couple of customers, is the V-locity I/O reduction software still worthwhile using in environments that use very fast storage such as flash or SSD? And as luck would have it, I have treated myself to one of these. So this is a NAND flash SSD stick, basically. It’s the Samsung SM961 Polaris one terabyte for you other geeks and nerds out there. What I can tell you is it’s very fast, huge amounts of I/Os per second, huge amounts of throughput. For my workstation machine, I’ve never used a machine that’s as fast as this that I’ve ever owned.
03:36 SA: So very pleased with the upgrade. But the question is, is our software still relevant? So what I’m gonna do is a lab test where I can spin up two machines and I have them ready here. Let’s just minimize that. So I’ve got a machine here on this side, which is a clone of this virtual machine here. So they are both running Windows Server 2016. They both will have a copy of V-locity installed. I’m gonna do that in just a second. And I’m gonna run up a copy of Iometer on both, and run what is roughly… If there is such a thing as an average SQL-type workload. That’s what I’m gonna try and do. You’ll see the specification, I’ll be quite transparent about that. And if you guys agree or disagree with the I/O workload configuration, well, please feel free to put your comments below. And if I need to re-do this test, I’ll be happy to do it because frankly, I love playing around with this stuff. It’s good fun. So without further ado, what I’m gonna do is we’ll flip over to that screen so that you can see it properly, and we’ll get everything set up, we’ll, run the test, and we’ll see.
04:52 SA: Will the copy of Iometer on the machine with V-locity enabled be able to get more work done in the same amount of time? Will it be able to process more I/Os per second, more throughput in megabytes per second? Basically, will it allow you to get more work done in the same amount of time, even though I’m already running very fast NVMe storage? Let’s see. I haven’t pre-run this test. So hopefully the results will be good. I’ve done that on purpose so that I can hopefully be pleasantly surprised, and hopefully you will be as well. And look, if it does show that we can get more work done in the same amount of time, just have a thing that we can do for you guys as well in your real-world environments. So anyway, enough talking for me. Let’s flip over to here, and we’ll start setting up the test and letting it run.
05:46 SA: Okay. So here we are on my main desktop. Forgive this little window up here on the top right. That’s the screen recording studio I’m using. That’s got nothing to do with this test. But what does, as I mentioned before, are these two virtual machines both running Windows Server 2016. So what I’m first going to do is install a copy of the V-locity software onto both of them, then on this one on the left, I’m gonna make sure it’s disabled, so it can’t actually do anything. And then we’ll generate a workload with Iometer and get the testing done. So let’s install a copy of V-locity, first of all. I’ve got a copy installed here. Sorry, a copy ready to install here. So let’s run that on this machine.
06:37 SA: Now, you’ll noticed during the install, or more importantly, just after the install, what I don’t have to do. And that is I don’t have to reboot the machine. I can install this software onto any live machine without disrupting its running workloads by having to reboot in any way. As you can see, it’s super easy to install, literally takes a minute or so. And then once it’s installed a few minutes after that, it will start providing benefit to the environment and making things perform better and easing the load a bit on that back-end storage.
07:14 SA: So that should complete. Okay. There we go. That’s completed now. So V-locity is installed on there. So what I’m gonna do is use this as my benchmark machine. So what I’m gonna do is open up V-locity and effectively disable it so that it can’t provide benefit on this machine. So we go into the configuration here, and basically turn all of the optimization features off and say apply. Okay. So V-locity is installed on there. To make sure these machines are exactly the same, I’m gonna install it onto the other machine as well. Here we go. So run the installer.
[pause]
08:13 SA: And again, won’t have to reboot, which is good. That was a great new feature that they introduced into V-locity 7 and Diskeeper 18 [and DymaxIO]. Previously, having to reboot was an absolute pain in the backside. Thankfully, now a thing of the past. Okay. So now V-locity is installed on both machines. This one here on the right is gonna have the benefit from the software, those features turned on. So now, let’s fire up a copy of Iometer on both. In fact, let’s bring up V-locity on here as well, so that we keep everything exactly the same. Okay. So the reason why we’ve got the spinning wheel is because the V-locity software is still effectively initializing. After a few minutes, you’ll start to see dashboard report data being populated on here. And I’ll show you that in more detail when we’ve actually got some data to take a look at.
09:18 SA: So for now, I’m gonna run a copy of Iometer on both machines, and this is what I’m gonna use to actually generate the workload. And as I mentioned before, I’m gonna roughly try and create a workload that you might typically see on something like a SQL server. Now, feel free to comment on this as I mentioned before, but there is no such thing as a typical SQL server load. So you can agree or disagree and feel free to let me know, but I’ll create a worker. In fact let’s create two workers on Drive C and we’ll do exactly the same over here. The workers are the things that actually create and control the workload that I’m gonna specify. So let’s specify them. So I’m gonna create a couple of new access specifications. So we’ll call this one SQL one, and we’ll have it do storage I/O requests that are 16 kilobytes in size. We’ll leave it at a 100% random, so that it should be even more difficult for the V-locity software to determine what to cache, we’ll give a bit of a test there, and we’ll leave this as it is. So it’s gonna be generating roughly 33% write I/O traffic and 67% read traffic. So that’ll be our SQL one.
10:40 SA: There we are down there. And I’m gonna do another one, which I’m gonna call SQL two. Not very imaginative, I know. But there you go. And this one I’m gonna do slightly larger packet sizes of 64 kilobytes. Again, 100% random, and we’ll leave the percent of read and write the same. Okay. So now we’ve got SQL one and SQL two. So I’m gonna do the same on the machine that has V-locity installed. So exactly the same set up. So SQL one is gonna have 16 kilobytes per packet, 100% random, 33% writes, 67% reads. And then we’ll set up SQL two as well. Good. And we’ll have that at 64 kilobytes. Okay. So now on both machines, we have our access specifications set up, and now we need to assign them to the workers. So we’ll assign SQL one to Worker one and to Worker two, that’s it, you’ve guessed, we’ll assign SQL two. And we’ll do the same over here as well. So now both machines are set up in exactly the same way. So let’s set up the results display and we’ll say update every couple of seconds. We’ll do that on both machines as well.
12:04 SA: Okay, good. And we will look at all of these metrics, but for now, let’s concentrate on the number of I/Os per second that Iometer is able to create and have processed on both machines. So what I’m gonna do just to make it a little bit more visual, is set up a speedo dial here, and we’ll set that to, let’s try 30,000. Okay. So the maximum on that dial is 30,000 I/Os per second, and we’ll do exactly the same over here. So now what remains is to start Iometer generating those workloads on both machines. Remember this one on the left is the one that has V-locity installed, but it’s disabled. So Iometer basically is going to be running just as if V-locity wasn’t installed. It’s gonna be exactly the same. And the one on the right over here, this one has V-locity installed and it’s all enabled. So if I’m right and this test goes the way I’m hoping it will, this one should be able to process after a few minutes, a higher amount of I/O traffic, more I/Os per second, than this one on the left that’s just running vanilla or generic. So which one do I start first? It probably doesn’t really make a great deal of difference, but we’ll start the non-V-locity machine first.
13:37 SA: There we go. And after a moment, it’ll start generating I/Os. Okay, there we go. So it started off by generating about 13000 I/Os per second. Now, let’s start this one over here, and initially they’re gonna be roughly at the same level, which they are, thankfully. Don’t have egg on my face yet. Okay. So now what we need to do is just wait for a few minutes and V-locity on this machine on the right will start learning about the workload that’s being run. And that’s one of the clever things about the software. It uses a telemetry technique to learn over time what type of applications are installed, what type of files are being accessed, what type of storage I/O streams are being generated, and at what times of the day, the week, the month, the quarter. So it can really use that intelligence to become very clever about, for example, what data needs to be put into the RAM cache that’s in the software, and more importantly, when, and also how best to size those I/O packets to give whatever the main application is the very best performance. And the great thing about it being an automatic telemetry technique is that if the way you use those machines change over time, the V-locity software will automatically adapt to those changes without you having to go and re-configure anything in V-locity or really play with it at all.
15:05 SA: It’s all very much a set-it-and-forget-it type product, and it will just always try and do the very best it can. So I’m looking now back at the I/Os per second, it’s still roughly the same on both machines. So V-locity, is still going through its learning curve. But very soon, we should start to see that creep up a bit on the right and it looks like it might be starting to a little bit… Oh, look at that. So 13000 to 21000. That’s pretty good. So, clearly more I/Os per second are being done by the machine with V-locity installed. Now, that’s predominantly gonna be because of that RAM caching. What it’s done is figured out those read I/Os that can be cached. It’s got that data into server-side RAM and it’s satisfying those read requests from there. Now, I mentioned at the beginning that I’m using a NAND flash drive here. It’s super fast. And well, as fast as it is, natively, with this test, about 12000 I/Os per second, which is really not to be sniffed at, that’s pretty fast, but with V-locity installed using that RAM, RAM is clearly faster, even still than that new flash drive that I’ve got in there. And the results are proving it.
16:44 SA: What is that? It’s roughly 8000 more I/Os can be processed every second. Now, that’s great for really busy machines. But think of what sort of impact that type of software technology could have if you have a virtual environment or a mixed physical server and a VM environment where they’re sharing that same back-end storage, where they’re sharing a SAN, for example. You’ve got loads of workloads, generating lots of storage, I/O traffic. And it’s all being funneled down through that host hypervisor and then on down to the storage at the back end. Imagine how much more work those machines can get done when we’re reducing that storage I/O traffic that actually has to go out to that slower storage and start really utilizing the power of that server-side RAM to really boost the performance of the applications. So let’s close off those dials for a moment and have a quick look at some of those other metrics in Iometer.
17:49 SA: So again, here at the top, this is the total number of I/Os per second. So it’s running at about 12500 on the machine without V-locity and over… So yeah, over 20000 on average. So a significant increase. In terms of the amount of data that’s being processed, how much is being throughput, that’s the next one here in total megabytes per second. So natively it’s let’s say is at about 490 megabytes per second, roughly? On the one with V-locity installed, that’s over 700 megabytes per second. So clearly it’s processing a greater amount of work. The next one is the average I/O response time in milliseconds. So that’s how long is it taking to satisfy an I/O request on average? So natively, I said this, storage was very fast, it’s 0.15 milliseconds. The one with V-locity though is 0.09. So it’s taking less time to satisfy I/O requests on the machine with V-locity installed. Now, this is quite interesting as well. The amount of CPU utilization, it seems to be roughly the same. It’s fluctuating a bit on both.
19:13 SA: So basically, we’re getting more work done clearly on this machine on the right with V-locity installed, but we’re really not using any more CPU or processor time. I would say this is a pretty successful test. So in answer to the question, is V-locity still relevant or Diskeeper for that matter, which is V-locity’s sister product for physical Windows on servers? I would say yes. If you care about performance and you really want to get the most out of your back-end storage, even if it is SSD, NAND flash, or an old flash array SAN, that’s an expensive piece of kit. If you wanna get the very most out of it, this is clearly a very easy way to do it. You saw how easy the software was to install. It’s not terribly expensive, unfortunately, which is why I’m still having to work doing videos like this. All joking aside, it’s not hugely expensive.
20:18 SA: No. It’s a hell of a lot less than what you would need to spend in hardware to get the same type of performance gains. But if you care about getting the most out of your storage, easy enough to give it a try. You can get a free no obligation 30-day trial, so that will run fully featured for the whole 30 days, and all you need to do to get that is to go to condusiv.com/try. In fact, I’ll show you, let me fire up my browser again, so condusiv.com/try, and you’ll see there’s a little form you fill out, and then within minutes you can be up and running with that software yourself, so, make sure that’s big enough for everyone to see, there we go. There we go, simple registration form, you then get the software 30 days, run it, and that’s the important thing because running lab tests is great to prove that the software works as advertised and it’s great to prove that it can still make a difference with very fast high IOPS storage. But what’s more important is, what can it actually do for you with the real world workloads that you run, with your applications, in your hardware environment, what difference can it make for you? Run it and see, it’s gonna cost you nothing other than the couple of minutes it takes to fill out that form, download and install the software.
21:48 SA: You’re not gonna disrupt anything, you saw there were no reboots required, those live running workloads can stay live up and running, run it for a couple of weeks, and then pull up the dashboard data here and see how much of that I/O traffic has been eliminated from having to go out to the storage. See what it can do for you. Now, just in case, I’m gonna bring up these dials again, so clearly, V-locity is having a beneficial effect on here, but how can we be certain, how can we be doubly certain that it’s definitely the V-locity software that’s causing this increase in workload to be processed? Well, I guess the easiest way is to suddenly turn V-locity off. So the quickest way of doing that is just to stop the V-locity service, so let’s do that. NET.STOP.V-locity. I’ll make that window a bit smaller, so we should be able to see a pretty immediate effect on this dial and it should drop down to about 12000 or 13000 similar to the one on the left, where V-locity is not optimizing anything. So I am going to hit the ENTER key right now, and let’s see if that needle drops. Okay, the V-locity service has stopped and yes, it’s immediately dropped back down. So now both machines are running just as they would as if V-locity wasn’t present.
23:25 SA: Now, just for a giggle, let’s start it back up again. Let’s start V-locity. Now, again, the service is starting up, it will take a couple of minutes to reestablish the cache and start providing benefit, but very quickly, we should start to see this needle move just as we did before when we first started it up. So let’s give that a moment to kick in and get initialized, and we’ll see if that needle starts moving again. Come on V-locity, don’t let me down. No, it does take a couple of minutes after starting it to start providing the benefit again. Oh, there it goes. Okay, so literally within minutes of getting that software installed, it should be providing a beneficial effect. Well, I would say that’s a pretty successful test, it certainly answers the question, if you have very fast flash storage, can the environment do more? Clearly, yes, it can. So the only question that I have is, why don’t you try it? Download it and see. And I’d love to hear your comments on this video down below, let me know what you think if you like this type of test, and you’re as geeky as I am, let me know. Maybe suggest other tests that I can do, I’d be happy to do that and yeah, let’s really put it through its paces. And don’t forget if you wanna try this software, condusiv.com/try. So thank you very much for taking the time to look at this. I hope it’s been interesting. And yeah, feel free to reach out to me if I can do any other videos like this? Alright, everyone, take care. Cheers.
Watch the faster NVMe storage video now.