Over time as more files and applications are added to your system, you notice that performance has degraded, and you want to find out what is causing it. A good starting point is to see how the system resources are being used and which processes and/or files are using them.
Both Diskeeper® and SSDkeeper® contain a lesser known feature to assist you on this. It is called the System Monitoring Report which can show you how the CPU and I/O resources are being utilized, then digging down a bit deeper, which processes or files are using them.
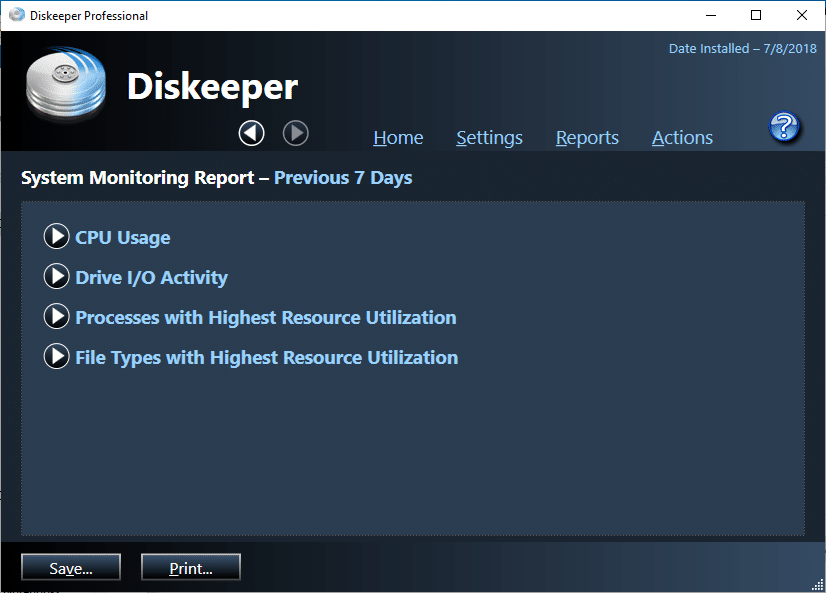
Under Reports on the Main Menu, the System Monitoring Report provides you with data on the system’s CPU usage and I/O Activity.
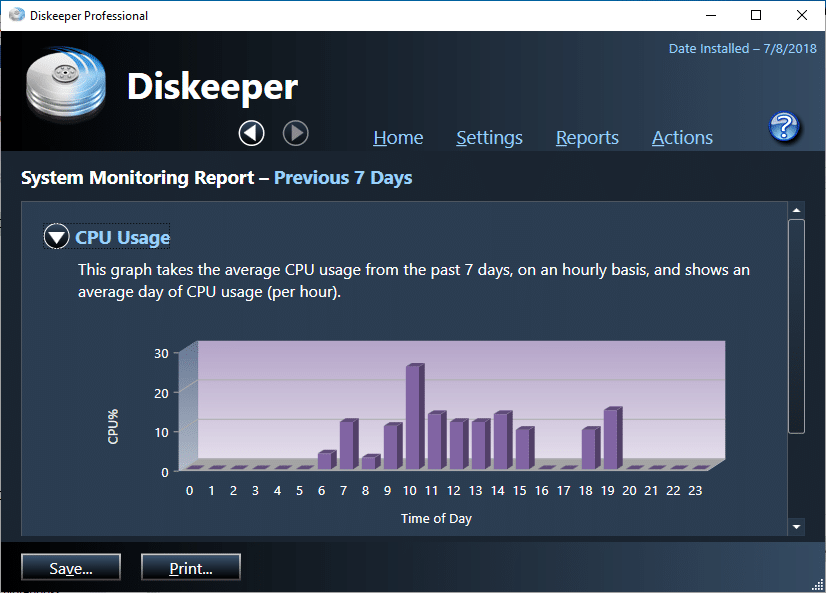
The CPU Usage report takes the average CPU usage from the past 7 days, then provides a graph of the hourly usage on an average day. You can then see at which times the CPU resources are being hit the most and by how much.
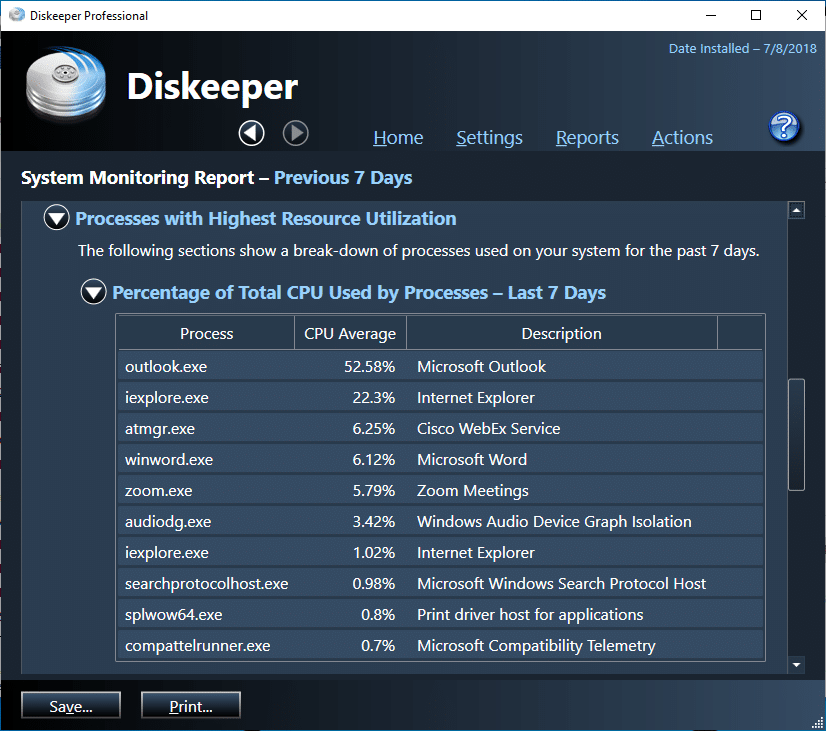
Digging down some more, you can then see which processes utilized the most CPU resources.
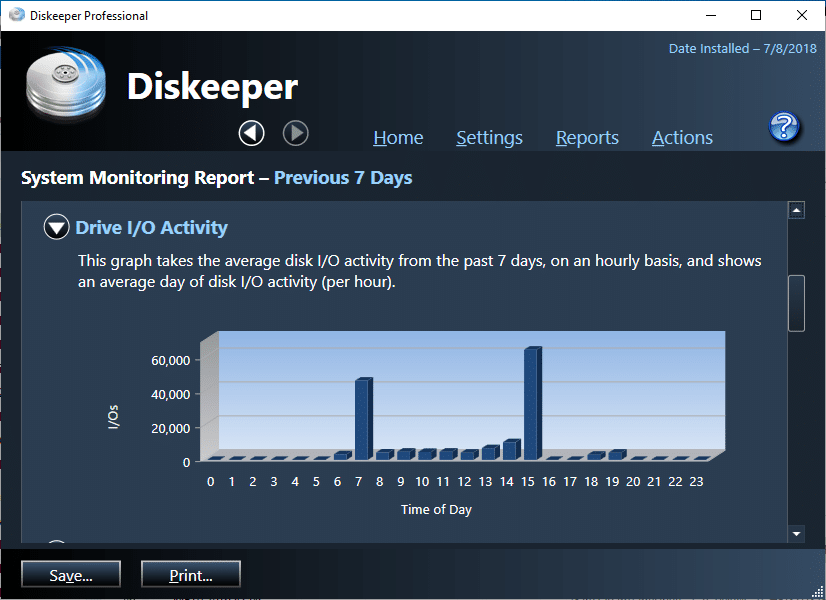
The Disk I/O Activity report takes the average disk I/O activity from the past 7 days, then provides a graph of the hourly activity on an average day. You can then determine at which times the I/O activity is the highest.
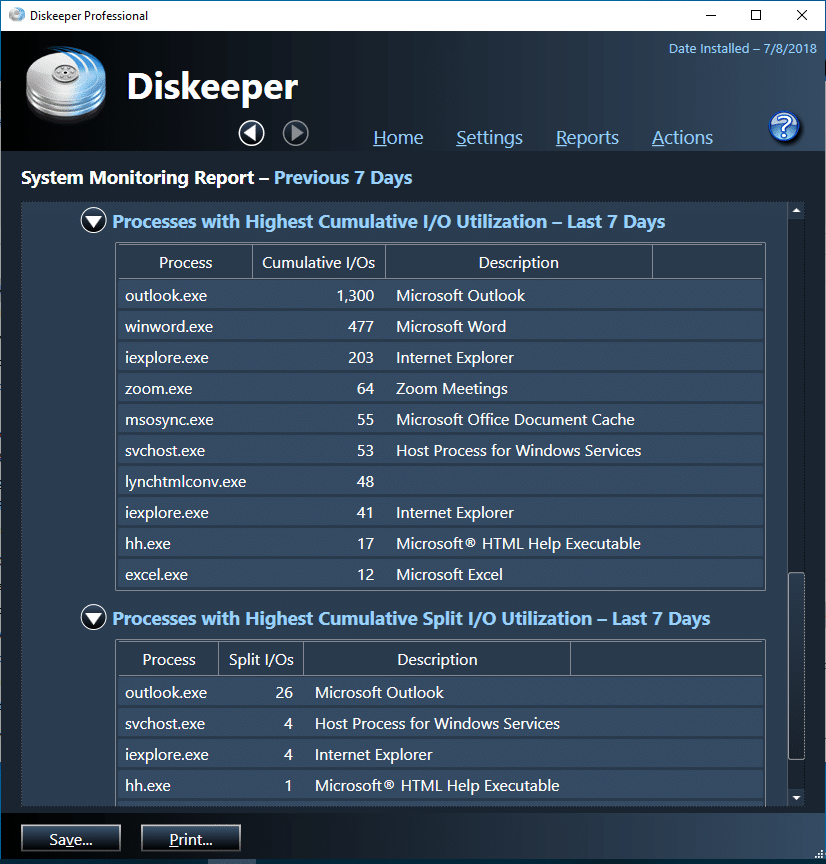
Digging down some more, you can then see which processes utilized the I/O resources the most, plus what processes are causing the most split (extra) I/Os.
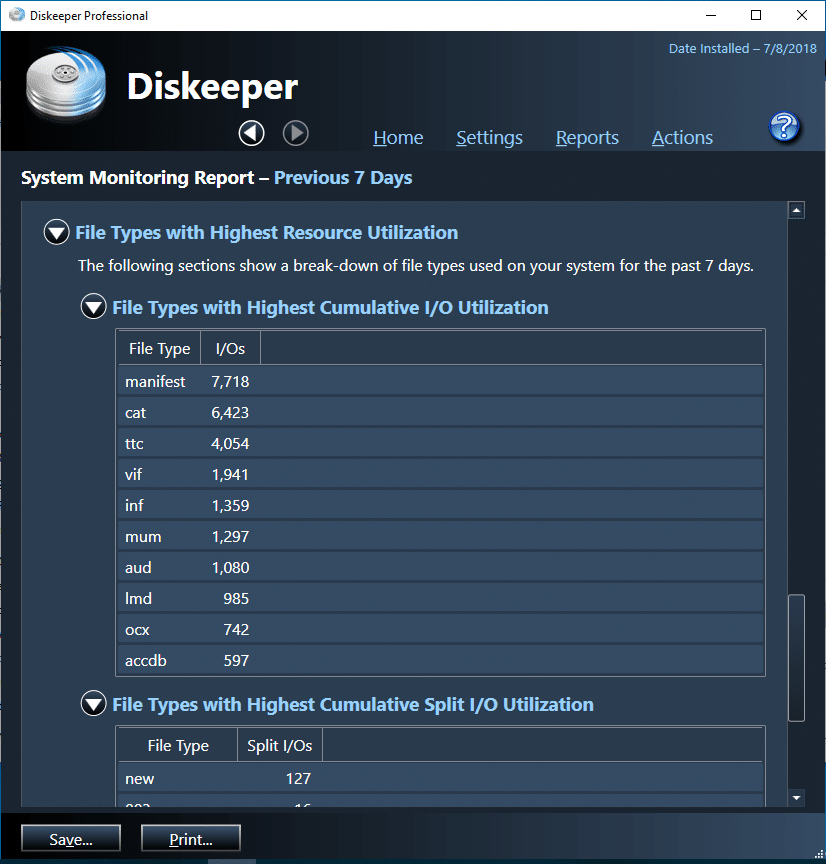
You can also see which file types have the highest I/O utilization as well as those causing the most split (extra) I/Os. This can help indicate what files and related processes are causing this type of extra I/O activity.
So, if you are trying to see how your system is being used, maybe for performance issues, this report gives you a quick and easy look on how the CPU and Disk I/O resources are being used on your system and what processes and file types are using them. This along with some other Microsoft Utilities, like Task Manager and Performance Monitor can help you tune your system for optimum performance.


Appreciate your depth of knowledge; very well written!
Interesting narrative on the metrics provided.
Would like to see more on how to address issues identified.