
If users are complaining that applications are slow, reports take forever to run, or performance degrades under load—but storage, CPUs, and memory all look fine—you’re not alone.
This is one of the most common and frustrating performance scenarios in Windows server environments, especially for SQL Server and other I/O-intensive applications. The infrastructure often appears healthy, hardware may even be overprovisioned, yet performance still collapses under real-world load.
In many cases, the root cause isn’t the storage array, the hypervisor, or the hardware—it’s how Windows generates and processes I/O under real-world workloads.
Disk Latency, Heavy Workloads, Poor Response Time
As an IT engineer, you play a crucial role in optimizing application performance and response times. One of the key factors affecting performance is disk latency, and in this article, we’ll explore effective strategies to address this issue. Whether you manage a busy SQL server, web server, file and print server, or other critical systems, reducing disk latency can significantly improve overall performance.
You might be responsible for a busy SQL server, for example, or a Web Server or perhaps a busy file and print server, the Finance Department’s systems, documentation management, CRM, BI, or something else entirely.
Now, think about WHY these are the workloads that you care about the most.
Were YOU responsible for installing the application running the workload for your company? Is the workload being run business-critical or considered TOO BIG TO FAIL?
Or is it simply because users, or even worse, customers complain about performance?
If the last question made you wince, because you know that YOU are responsible for some of the workloads running in your organization that would benefit from additional performance, please read on. This article is just for you, even if you don’t consider yourself a “Techie”.
Why “Nothing Looks Broken” — Yet Performance Still Suffers
When performance degrades under load, most administrators instinctively look to storage latency, CPU utilization, or memory pressure. When those metrics appear normal, the assumption is often that the hardware should be more than capable of handling the workload.
What’s frequently overlooked is the inefficiency of the I/O being generated by Windows itself—particularly under concurrent workloads such as SQL queries, reporting jobs, VDI activity, or mixed application usage.
Small, fragmented, and competing I/O requests can overwhelm even fast storage, creating bottlenecks that don’t immediately show up in traditional monitoring tools. The result is sluggish applications, user complaints, and pressure to “do something now”—often by throwing more hardware at the problem.
This same “nothing looks broken” pattern also appears in virtual desktop environments, where performance can degrade as user concurrency increases — even when storage and infrastructure metrics look healthy.
👉 Why VDI performance degrades under load (even when storage looks fine)
These Variables Affect the Performance of Your Applications
Before we get started, you should know that there are many variables that can affect the performance of the applications that you care about the most. The slowest, most restrictive of these is referred to as the “Bottleneck”. Think of water being poured from a bottle. The water can only flow as fast as the neck of the bottle, the ‘slowest’ part of the bottle.
Don’t worry though, in a computer the bottleneck will pretty much always fit into one of the following categories:
- CPU
- DISK
- MEMORY
- NETWORK
The good news is that, if you’re running Windows, it is usually very easy to find out which one is causing the bottleneck. Here is how to do it like an IT Engineer:
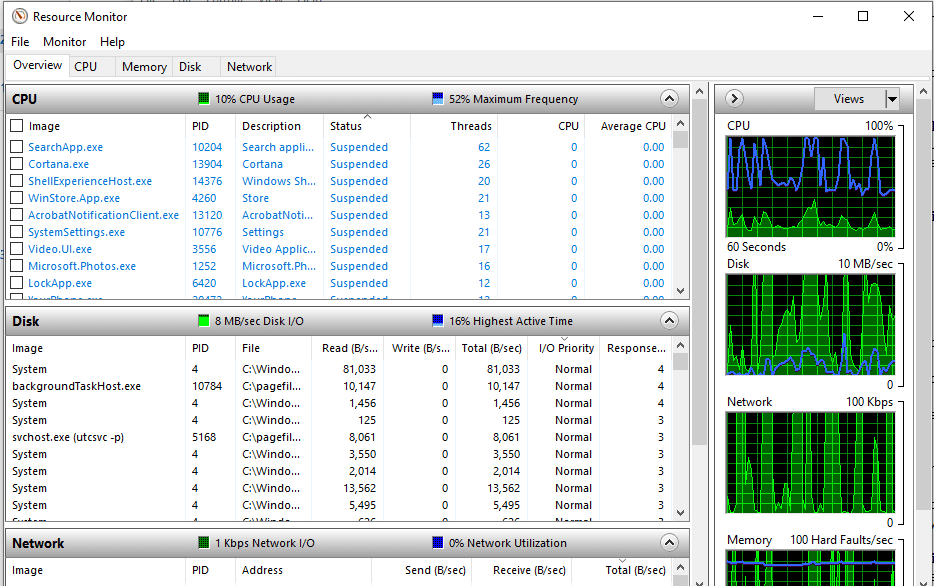
- Open Resource Monitor by clicking the Start menu, typing “resource monitor”, and press Enter. Microsoft includes this as part of the Windows operating system and it is already installed.
- Do you see the graphs in the right-hand pane? When your computer is running at peak load, or users are complaining about performance, which of the graphs are ‘maxing out’?
This is a great indicator of where your workload’s bottleneck is to be found.
What YOU Can Do to Reduce Disk Latency & Improve Response Times
SO, now you have identified the slowest part of your ‘compute environment’ (continue reading for more details), what can you do to improve it?
The traditional approach to solving computer performance issues has been to throw more hardware at the solution. This could be treating yourself to a new laptop, or putting more RAM into your workstation, or on the more extreme end, buying new servers or expensive storage solutions.
BUT, how do you know when it is appropriate to spend money on new or additional hardware, and when it isn’t. Well, the answer is ‘when you can’t get the performance that you need’ with the existing hardware infrastructure that you have already bought and paid for.
You wouldn’t replace your car, just because it needed a service, would you?
Is Your Disk Response Time High?
If disk latency consistently spikes during peak workloads — especially during SQL reporting jobs, VDI login storms, or batch processing windows — the issue may not be failing storage hardware. In many environments, the real bottleneck is how Windows generates and processes I/O under concurrency.
Let’s take disk speed as an example. Let’s take a look at the response time column in Resource Monitor. Make sure you open the monitor to full screen or large enough to see the data. Then open the Disk Activity section so you can see the Response Time column. Do it now on the computer you’re using to read this. (You didn’t close Resource Monitor yet, did you?)
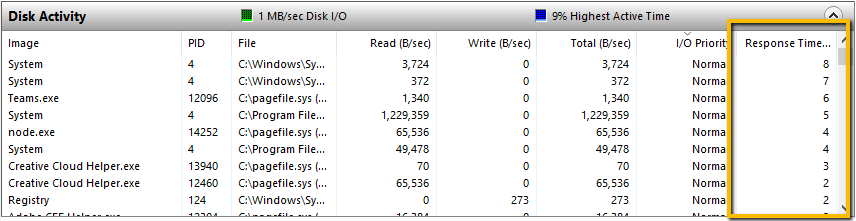
This is showing the Disk Response Time, or put another way, how long is the storage taking to read and write data? Of course, slower disk speed = slower performance, but what is considered good disk speed and bad?
To answer that question, I will refer to a great blog post by Scott Lowe with TechRepublic: Use Resource Monitor to monitor storage performance
In it, the author perfectly describes what to expect from faster and slower Disk Response Times:
“Response Time (ms). Disk response time in milliseconds. For this metric, a lower number is definitely better; in general, anything less than 10 ms is considered good performance. If you occasionally go beyond 10 ms, you should be okay, but if the system is consistently waiting more than 20 ms for response from the storage, then you may have a problem that needs attention, and it’s likely that users will notice performance degradation. At 50 ms and greater, the problem is serious.”
Hopefully, when you checked on your computer the Disk Response Time is below 10 milliseconds. BUT, what about those other workloads that you were thinking about earlier. What are the Disk Response Times on that busy SQL server, the CRM or BI platform, or those Windows servers that the users complain about?
Another aspect that shouldn’t be overlooked is the Disk Queue Length (select the Disk tab). This measures the backlog of I/O requests that are “waiting” to be serviced because the storage array is already busy doing other work.
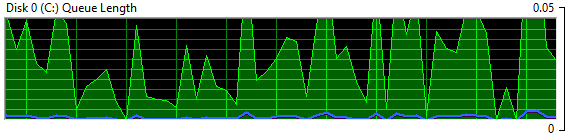
This can indicate there aren’t enough disk spindles or I/O channels to properly handle the workload and these I/O’s must wait their turn in line before the storage array begins to service the request. Reducing the I/O traffic workload is a much more attractive solution than adding more hardware.
Addressing I/O Inefficiency at the Source
Instead of reacting to performance problems by upgrading hardware or storage tiers, many organizations focus on reducing unnecessary I/O before it ever reaches the storage layer.
By optimizing how Windows generates read and write operations—consolidating inefficient I/O patterns and intelligently caching read activity—performance improves across applications without changing hardware, reconfiguring storage, or disrupting production systems.
This approach is especially effective for SQL Server environments under load, virtualized workloads, and systems under sustained concurrency.
Learn how DymaxIO addresses I/O inefficiencies directly inside Windows.
Two Options for Disk Response Times 10+ Milliseconds
If the Disk Response Times are often higher than 10 milliseconds, and you need to improve the application performance, then it’s choice time and there are basically two options:
- In my opinion as an IT Engineer, the most sensible option is to use storage workload reduction software like DymaxIO® (Diskeeper®, SSDkeeper®, and V-locity® are now new DymaxIO fast data software). This will reduce Disk Storage Times by allowing a good percentage of the data that your applications need to read, to come from a RAM cache, rather than slower disk storage. This works because RAM is much faster than the media in your disk storage. DymaxIO also includes other technologies to boost I/O performance. Best of all, the only thing you need to do to try it is download a free copy of the 30-day trial. You don’t even have to reboot the computer; just check and see if it can bring the Disk Response Times down for the workloads that you care about the most.
- If you have tried the DymaxIO software, and you STILL need faster disk access, then I’m afraid it’s time to start getting quotations for new hardware. It does make sense though, to take a couple of minutes to install DymaxIO first, to see if this step can be avoided. The software solution to remove storage inefficiencies is typically a much more cost-effective solution than having to buy hardware!
As an IT engineer, you hold the power to improve application performance by addressing disk latency effectively. Identify the bottleneck, monitor disk response times and queue length, and explore suitable solutions like DymaxIO to optimize I/O performance. Enhancing disk performance can lead to a smoother experience for your users and customers alike. Download your free trial of DymaxIO today and experience the difference it can make in reducing disk latency and improving application response times.
See How Much I/O Your System Is Wasting
Run the free 30-day DymaxIO trial and see how much unnecessary I/O your system can eliminate — with true “Set It and Forget It®” ease.
• No reboot required
• No credit card required
• Works on physical, virtual, and cloud servers

Originally published Jun 13, 2018. Updated Apr 29, 2021, Jul 14, 2021, Feb 9, 2022, Aug 8, 2022, July 26, 2023, January 8, 2026


Hi Greg,
Thank you for using Diskeeper for years. You can still continue to use Diskeeper on your PC, see our blog blog.condusiv.com/…/…ntation-in-5-Minutes.aspx
Our recommendation is if you already have Diskeeper installed on your PC with an SSD, you are fine and do not need to change. If you have a new system with an SSD drive and do not have our software installed yet, then you can install SSDkeeper.
Condusiv Technologies
Greetings,
I have used your Diskeeper for years …. until I started using and SSD drive. Now I am a little confused as to what product I should be using on my system now. Do I use diskeeper 18 or do I use the SSDKeeper? And what is the difference between the SSDkeeper and the Pro version? I am a day trader and have a lot of data moving on a daily basis and I also use photo shop quite a bit. What is your recommendation for my windows computer with a SSD drive?
Cheers,
Greg