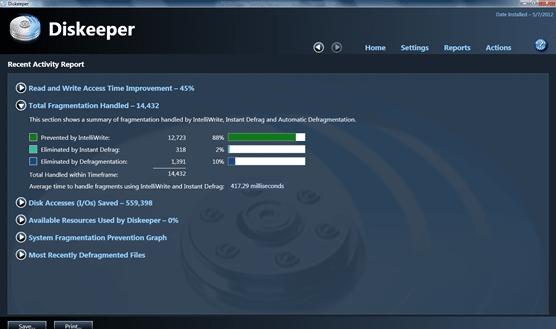
We have an online FAQ that I thought I’d post here as well. It provides some valuable insight into what’s going on with all those graphs and statistics related to our proprietary new IntelliWrite technology.
IntelliWrite Fragmentation Prevention
This section of the Dashboard tab explains that IntelliWrite increases system performance by preventing fragmentation before it happens.
IntelliWrite System Statistics for All Volumes Since the Previous Day

This section of the Dashboard Tab includes statistical information regarding fragmentation prevented by IntelliWrite, fragmentation eliminated by Automatic Defragmentation, and a sum of the two numbers since the previous day.
It is important to note that the amount of fragmentation prevented is an estimation determined by a large number of factors and extensive testing. The IntelliWrite graphs are designed to approximate fragments prevented across a wide range of applications and must incorporate various types of file writes and modifications into a singular display. In some cases the charts may over-estimate and in other cases, underestimate. For example, on SQL Server® the graphs may overestimate about 10% of the fragmentation prevented, on Microsoft® Office documents it may underestimate the number of fragments prevented by 80%. What is important is that with IntelliWrite enabled, fragmentation is being handled, before it happens. The end result of having Diskeeper with IntelliWrite and Automatic Defragmentation working is a system running at peak performance in the most efficient way possible (without fragmentation).
The statement: “Proactive prevention is the most energy efficient method to eliminate increased storage power consumption caused by fragmentation,” points out that when IntelliWrite is handling your system’s fragmentation, it is reducing the amount of disk head movement previously needed to accomplish defragmentation and therefore is reducing Diskeeper’s total system resource footprint.
System Fragmentation Prevention Graph

This section of the Dashboard tab shows system fragmentation prevented by IntelliWrite in real-time. In the graph, fragmentation prevented every second, within the last minute, for your entire system, is displayed in green. The scale on the left side of the graph pertains to the number of fragments that have been prevented and the scale along the top of the graph pertains to the seconds in the last minute.
Statistical Information for Selected Volume(s) Since the Previous Day
This section of the Dashboard tab shows statistical information for selected volume(s) since the previous day. The columns of the table include the name of the selected volume(s), whether or not IntelliWrite and Automatic Defragmentation are enabled, the number of fragments prevented, the number of fragments eliminated and file read/write time % improvement.


Hi Oliver,
In an artificial lab with an isolated activity, sure there is merit. Real world wise, environments like that don’t exist, or if they do, don’t last but a few seconds. It also takes a tremendous amount of file movement to get to that pretty picture. The other fact that is missing is that free space fragmentation (unless severe – which it is not even close to being severe in those cases) is a moot point with IntelliWrite – as it will prevent fragmentation.
We have a great deal of more info to share about IntelliWrite, including "test at home" routines, real word studies, details on how it functions, and more. We’ll get to publishing here or in white papers, case studies, etc…
Have you seen this recent posting by [product name removed]?
It would be good to get your response – as a separate blog entry.
Is there any merit to [product name removed] claims that Intelliwrite, in the example they give, actually produces a WORSE result for fragmentation, than not using Intelliwrite at all.
Would like to hear Diskeeper’s view of this article.
Thanks.