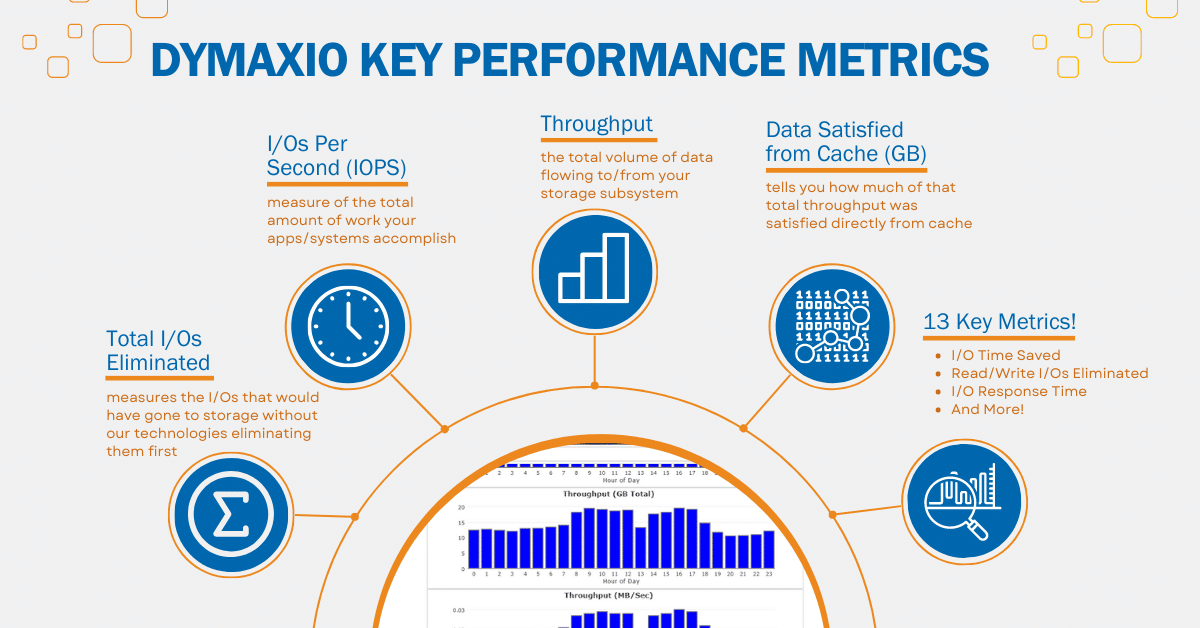
Our DymaxIO software includes a built-in dashboard that reports the benefits our software is providing. There are tabs in the dashboard that allow users to view very granular data that can help them assess the impact of our software. In the dashboard Analytics tab we display hourly data for 13 key metrics. This document describes what those metrics are and why we chose them as key to understanding your storage performance, which directly translates to your application performance.
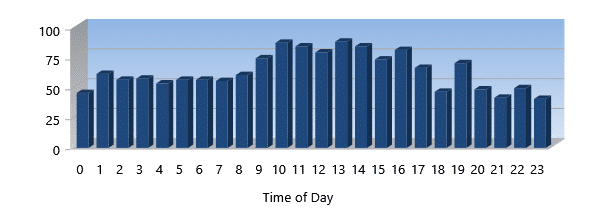
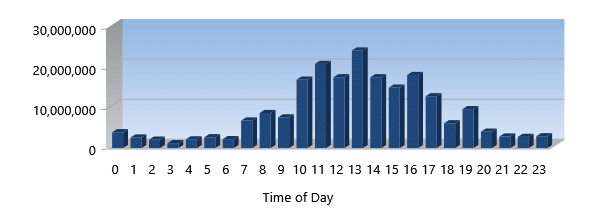
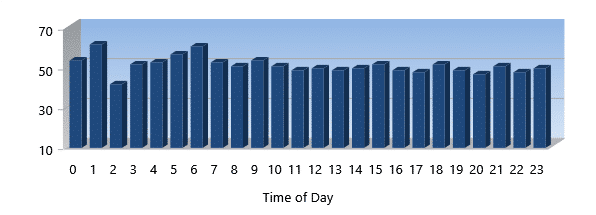
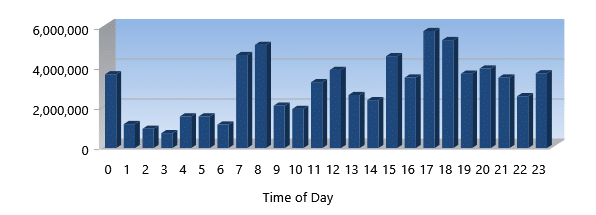
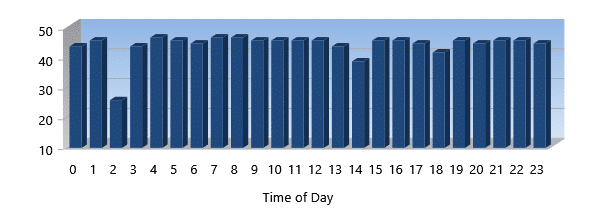
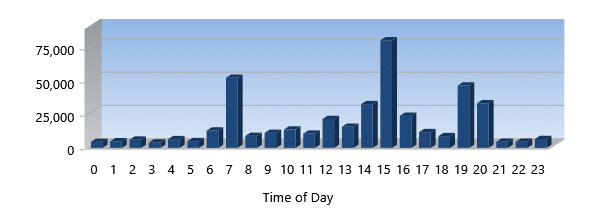
To start with, let’s spend a moment trying to understand why 24-hour graphs matter. When you, and/or your users really notice bottlenecks is generally during peak usage periods. While some servers are truly at peak usage 24×7, most systems, including servers, have peak I/O periods. These almost always follow peak user activity.
Sometimes there will be spikes also in the overnight hours when you are doing backups, virus scans, large report/data maintenance jobs, etc. While these may not be your major concern, some of our customers find that these overlap their daytime production and therefore can easily be THE major source of concern. For some people, making these happen before the deluge of daytime work starts, is the single biggest factor they deal with.
Regardless of what causes the peaks, it is at those peak moments when performance matters most. When little is happening, performance rarely matters. When a lot is happening, it is key. The 24-hour graphs allow you to visually see the times when performance matters to you. You can also match metrics during specific hours to see where the bottlenecks are and what technologies of ours are most effective during those hours.
Let’s move on to the actual metrics.
Total I/Os Eliminated
Total I/Os eliminated measures the number of I/Os that would have had to go through to storage if our technologies were not eliminating them before they ever got sent to storage. We eliminate I/Os in one of two ways. First, via our patented IntelliMemory® technology, we satisfy I/Os from memory without the request ever going out to the storage device. Second, several of our other technologies, such as IntelliWrite® cause the data to be stored more efficiently and densely so that when data is requested, it takes less I/Os to get the same amount of data as would otherwise be required. The net effect is that your storage subsystems see less actual I/Os sent to them because we eliminated the need for those extra I/Os. That allows those I/Os that do go to storage to finish faster because they aren’t waiting on the eliminated I/Os to complete.
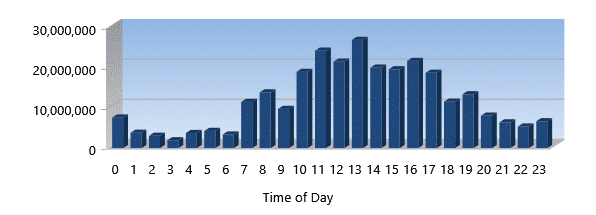
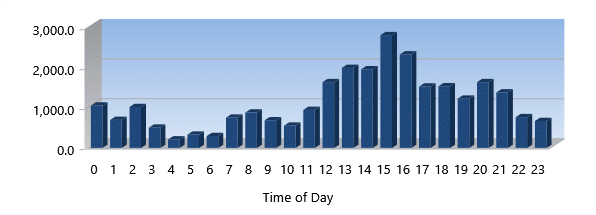
IOPS
IOPS stands for I/Os Per Second. It is the number of I/OS that you are actually requesting. During the times with the most activity, I/Os eliminated actually causes this number to be much higher than would be possible with just your storage subsystem. It is also a measure of the total amount of work your applications/systems are able to accomplish.
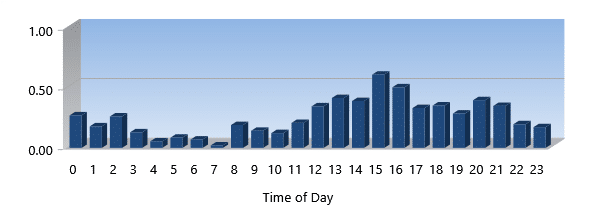
Data from Cache (GB)
Data from cache tells you how much of that total throughput was satisfied directly from cache. This can be deceiving. Our caching algorithms are aimed at eliminating a lot of small noisy I/Os that jam up the storage subsystem works. By not having to process those, the data freeway is wide open. This is like a freeway with accidents. Even though the cars have moved to the side, the traffic slows dramatically. Our cache is like accident avoidance. It may be just a subset of the total throughput, but you process a LOT more data because you aren’t waiting for those noisy, necessary I/Os that hold your applications/systems back.
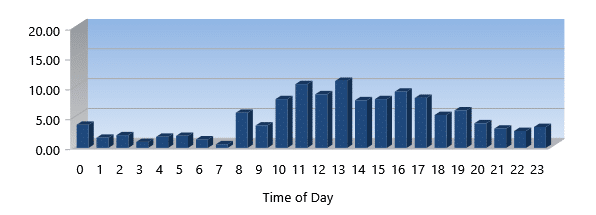
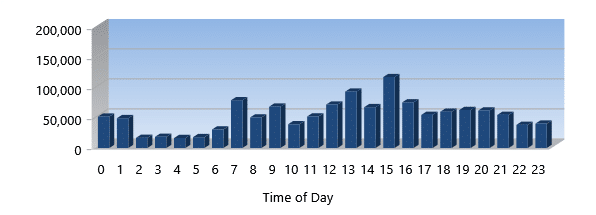
Throughput (GB Total)
Throughput is the total amount of data you process and is measured in GigaBytes. Think of this like a freight train. The more railcars, the more total freight being shipped. The higher the throughput, the more work your system is doing.
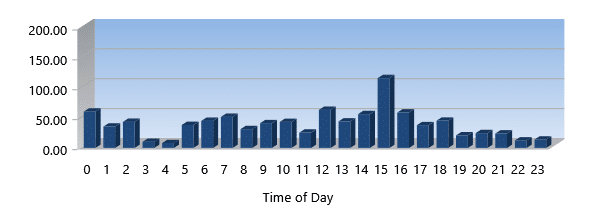
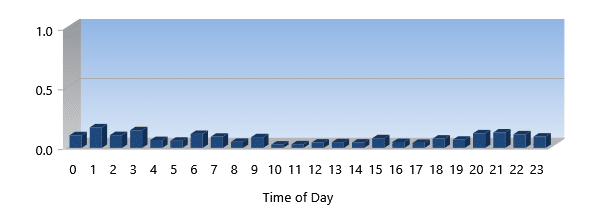
Throughput (MB/Sec)
Throughput is a measure of the total volume of data flowing to/from your storage subsystem. This metric measures throughput in MegaBytes per second kind of like your speedometer versus your odometer.
I/O Time Saved (seconds)
The I/O Time Saved metric tells you how much time you didn’t have to wait for I/Os to complete because of the physical I/Os we eliminated from going to storage. This can be extremely important during your busiest times. Because I/O requests overlap across multiple processes and threads, this time can actually be greater than elapsed clock time. And what that means to you is that the total amount of work that gets done can actually experience a multiplier effect because systems and applications tend to multitask. It’s like having 10 people working on sub-tasks at the same time. The projects finish much faster than if 1 person had to do all the tasks for the project by themselves. By allowing pieces to be done by different people and then just plugging them altogether you get more done faster. This metric measures that effect.
I/O Response Time
I/O Response time is sometimes referred to as Latency. It is how long it takes for I/Os to complete. This is generally measured in milliseconds. The lower the number, the better the performance.
Read/Write %
Read/Write % is the percentage of Reads to Writes. If it is at 75%, 3 out of every 4 I/Os are Reads to each Write. If it were 25%, then it would signify that there are 3 Writes per each Read.
Read I/Os Eliminated
This metric tells you how many Read I/Os we eliminated. If your Read to Write ratio is very high, this may be one of the most important metrics for you. However, remember that eliminating Writes means that Reads that do go to storage do NOT have to wait for those writes we eliminated to complete. That means they finish faster. Of course, the same is true that Reads eliminated improves overall Read performance.
% Read I/Os Eliminated
% Read I/Os Eliminated tells you what percentage of your overall Reads were eliminated from having to be processed at all by your storage subsystem.
Write I/Os Eliminated
This metric tells you how many Write I/Os we eliminated. This is due to our technologies that improve the efficiency and density of data being stored by the Windows NTFS file system.
% Write I/Os Eliminated
% Write I/Os Eliminated tells you what percentage of your overall Writes were eliminated from having to be processed at all by your storage subsystem.
Fragments Prevented and Eliminated
Fragments Prevented and Eliminated gives you an idea of how we are causing data to be stored more efficiently and dense, thus allowing Windows to process the same amount of data with far fewer actual I/Os.
If you have DymaxIO installed, you can open the Dashboard now and select the Analytics tab and see all of these metrics.
If you own and use our V-locity®, Diskeeper® and SSDkeeper® products, later versions also included a built-in dashboard with these 13 performance metrics as well. V-locity, Diskeeper and SSDkeeper are now DymaxIO!
If you are not a customer yet and want to checkout these dashboard metrics, download a free trial of DymaxIO here.
Originally published on: Jul 11, 2018. Most recent update Jan 16, 2023.


Leave A Comment
You must be logged in to post a comment.