
You Can Stop The I/O Performance Frustration!
IT pros know all too well the pain and frustration due to I/O performance problems such as users getting disconnected and complaining, SQL reports or queries taking forever or timing out, annoyingly slow applications causing users to wait, lose productivity and complain, backups failing to complete in the allotted window or even having to constantly reboot the servers to restore performance for a bit. Troubleshooting these issues can cost you many late nights, lost weekends, and even missing important events.
These issues are commonly traced back storage I/O efficiencies.
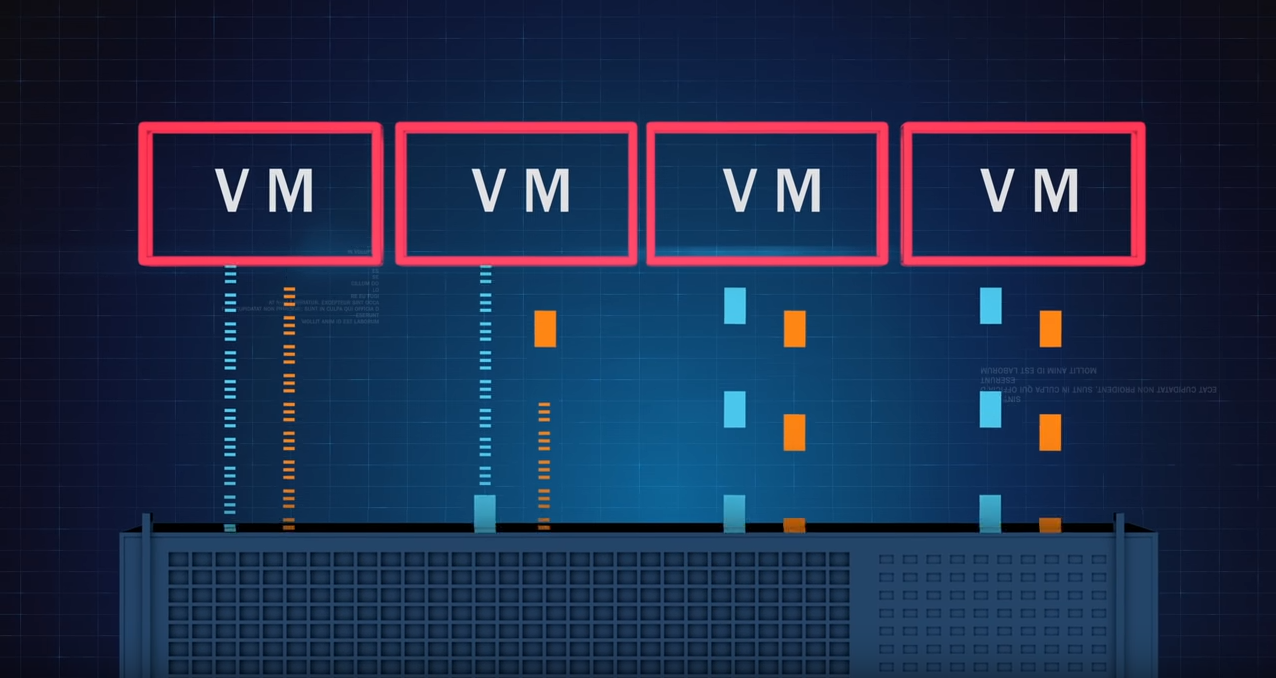
No matter the underlying storage, the Windows file system will tend to break up writes into separate storage I/Os and send each I/O packet down to the storage layer separately causing I/O characteristics that are much smaller, more fractured, more random than they need to be. In a virtual environment, the I/O blender effect comes into play mixing and randomizing I/O streams coming from the different virtual machines on that hypervisor, causing I/O contention.
This means systems process workloads about 50% slower than they should on the typical Windows server because far more I/O is needed to process any given workload. This is the cause of a host of Windows performance problems.
Performance issues in VDI environments often follow the same diagnostic pattern.
👉 Why VDI performance degrades under load (even when storage looks fine)
So, how do you know if your servers have fallen prey to I/O performance problems? You can stop guessing and find out for sure. It’s easy, run the FREE Condusiv I/O Assessment Tool.
See How Well Your Storage Is Performing
The Condusiv I/O Assessment tool is designed to provide you with the ability to see how well your storage is performing. It gathers numerous storage performance metrics that Windows automatically collects over an extended period of time – we recommend 5 days. It then performs numerous statistical analyzes looking for potential problems throughout the period the monitoring took place. It even looks for potential areas of cross-node conflicts. By correlating across multiple systems, it can infer that nodes are causing performance issues for each other during the overlapping periods of time. It then displays several metrics that will help you understand where potential bottlenecks might be.
The tool has 4 basic phases:
- Setup
- Data Collection
- Analysis
- Reporting
Full technical details on these phases are available here.
Identifying the Source of Performance Issues
Once the tool has run, it will have identified and ranked the systems with the most I/O issues and display what those issues are across 11 different key performance metrics by identifying performance deviations when workload is the heaviest.
The reporting screen will display three main sections:
- Summary of systems in data collection
- Series of individual storage performance metrics
- Conclusions about your storage performance for selected systems
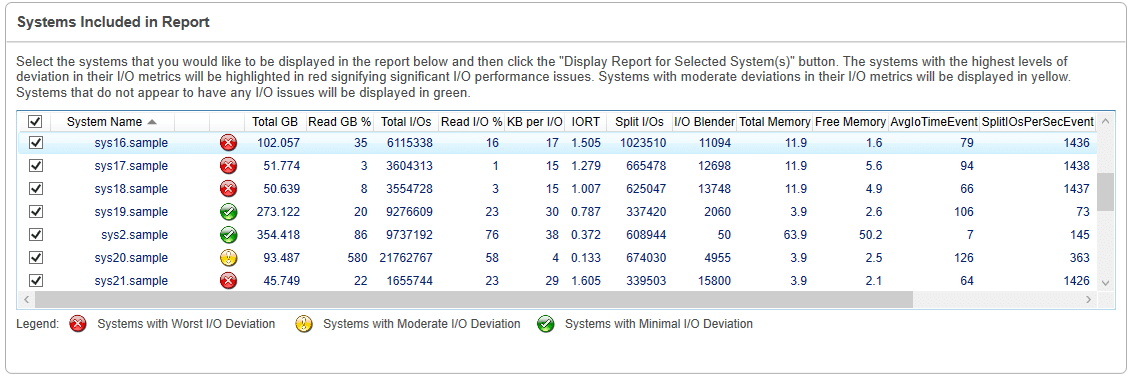
In the summary section, there is a grid containing the list of systems that are available from the data collection you just collected data on or imported. The grid also contains totals for each system for the various metrics for the entire time of the data collection. The list is sorted from systems that have potential storage performance issues to those that do not appear to have storage performance issues. The systems that have storage performance issues are highlighted in red. The systems that might have storage performance issues are in yellow. The systems that do not appear to have storage performance issues are in green. By default, the systems that have storage performance issues are selected for the report. You can select all the systems, or any set of systems including a single system, for reporting on.
Once you have selected some systems to report on and asked to display the report, you can expand 11 key performance metrics:
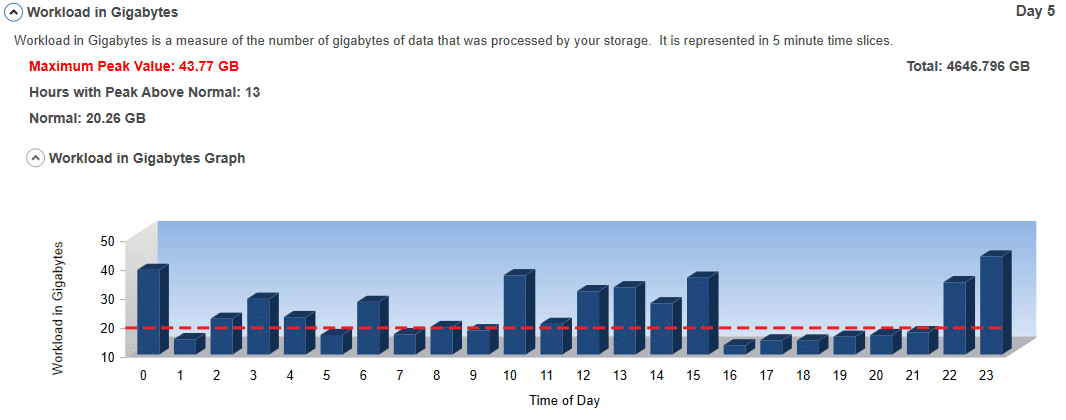
#1 Workload in Gigabytes:
This is a measure of the number of Gigabytes of data that was processed by your storage. It is represented in 5-minute time slices. The peaks indicate when the storage is being used the most and can show you periods where you can offload some work to provide greater performance during peak load periods. The valleys indicate periods of lower storage utilization.
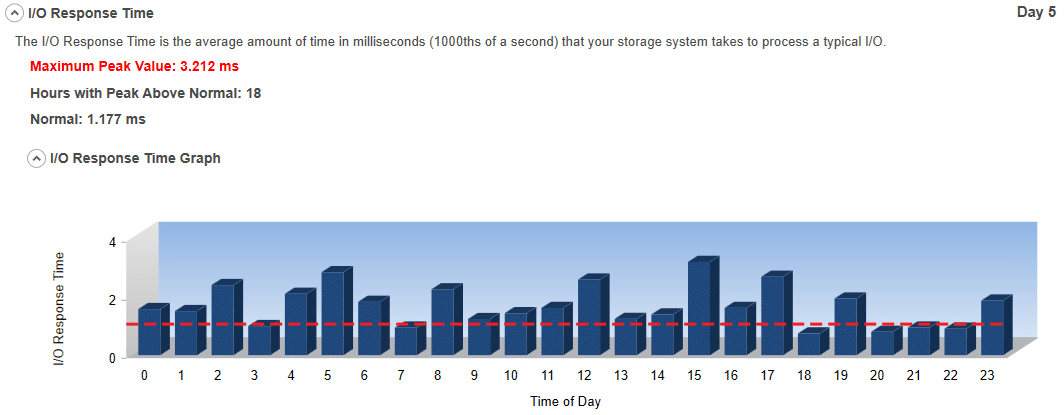
#2 I/O Response Time:
The I/O Response Time is the average amount of time in milliseconds (1000ths of a second) that your storage system takes to process any one I/O. The higher the I/O Response Time, the worse the storage performance. The peaks indicate possible storage performance bottlenecks.
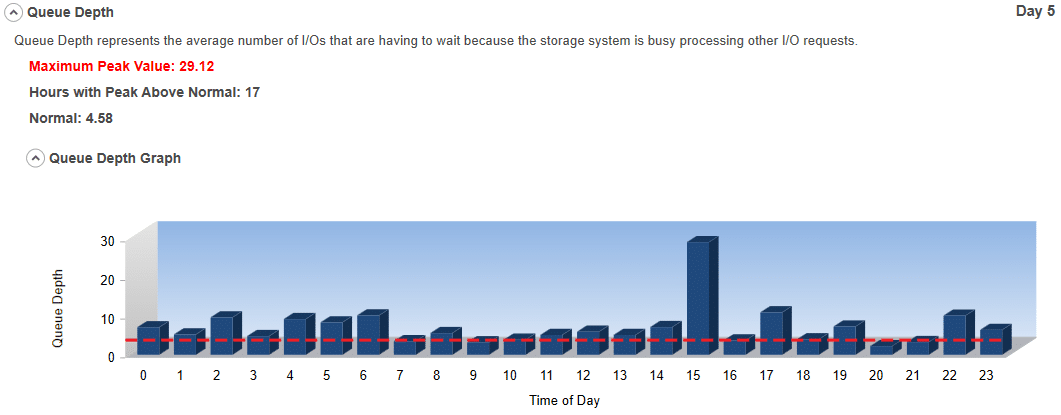
#3 Queue Depth:
Queue Depth represents the number of I/Os that are having to wait because the storage is busy processing other I/O requests. The larger the value, the more the storage system is struggling to keep up with your need to access data. The higher the queue depth, the worse the storage performance. It directly correlates to inefficient storage performance.
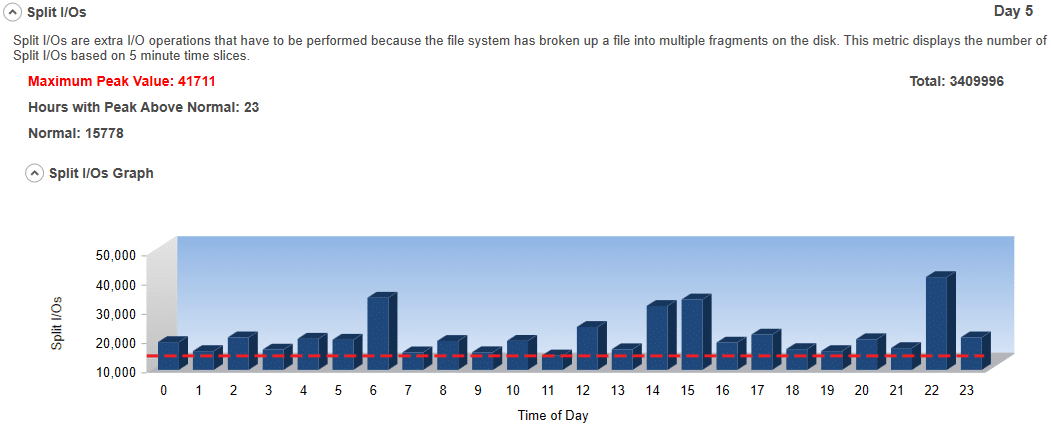
#4 Split I/Os:
Split I/Os are extra I/O operations that have to be performed because the file system has broken up a file into multiple fragments on the disk. To have a truly dynamic file system with the ability for files to be different sizes, easily expandable, and accessible using different sized I/Os, file systems have to break files up into multiple pieces. Since the size of volumes has gotten much larger and the number of files on a volume has also exploded, fragmentation has become a more severe problem. However, not all file fragments cause performance problems. Sometimes I/Os are done in such a manner that they are aligned with the file allocations and therefore always fit within a file’s fragments. Most of the time, however, that is simply not the case. When it isn’t the case, a single I/O to process data for an application may have to be split up by the file system into multiple I/Os. Thus, the term – Split I/O. When the free space gets severely fragmented, this becomes even more likely and accelerates the rate of fragmentation and therefore corresponding Split I/Os. Split I/Os are bad for storage performance. Preventing and eliminating Split I/Os is one of the easiest ways to make a big difference in improving storage performance.
See I/Os Are Not Created Equal – Random I/O versus Sequential I/O for more detail.
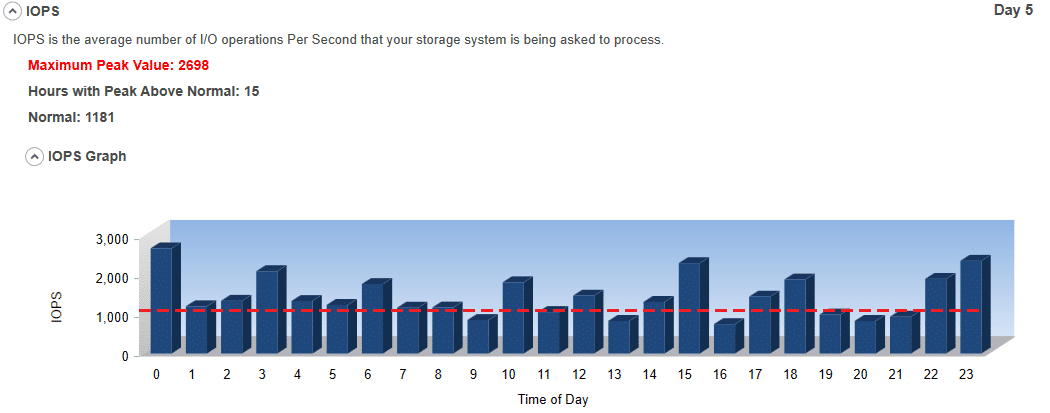
#5 IOPS:
IOPS is the average number of I/O Operations per second that your storage system is being asked to perform. The higher the IOPS, the more work that is being done. This could indicate an I/O Performance Problem.
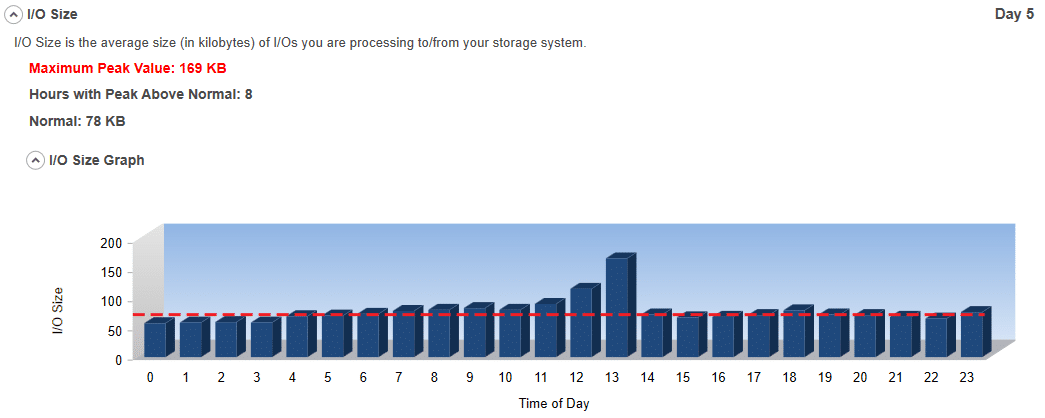
#6 I/O Size:
I/O Size is the average size (in kilobytes) of I/Os you are performing to your storage system. It is an indication of how efficient your systems are processing data. Generally, the smaller the I/O size, the more inefficient the data is being processed. Please note that certain applications may just process smaller I/Os. They tend to be exceptions to the rule, however.
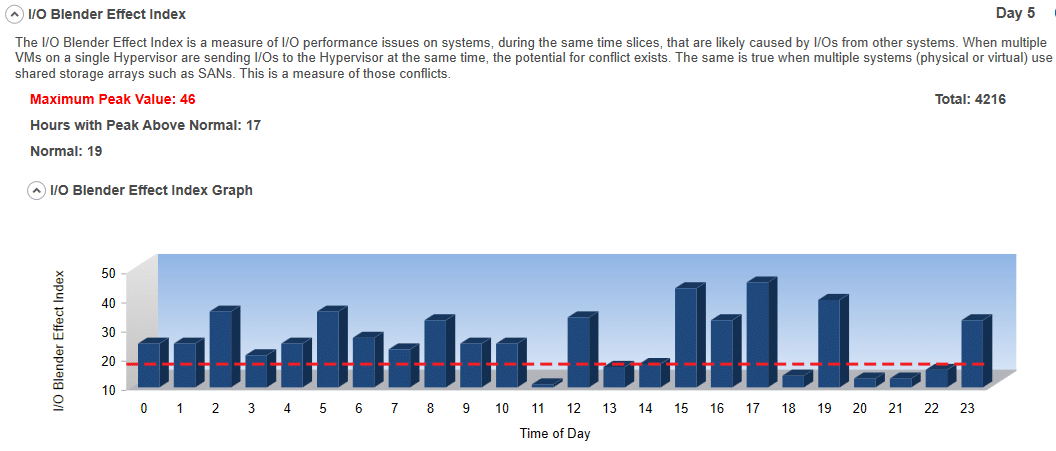
#7 I/O Blender Effect Index:
This is a measure of I/Os from multiple systems at the same time that are likely causing I/O performance problems. The problem is caused because they conflict with I/Os from other systems at the same time. When multiple VMs on a single Hypervisor are sending I/Os to the Hypervisor at the same time, the potential for conflict rears its ugly head. The same is true when multiple systems (physical or virtual) are using shared storage such as SANs. Because this tool will collect data from multiple systems in small, discreet, and overlaid periods of time, it can estimate contention. By searching for periods where performance appears to be suffering and then checking to see if any other system is having a potential problem during the same time, the tool can determine statistically that this particular period of time is problematic due to cross-node interference. The amount of cross-node conflict is taken into consideration, thus creating the index.
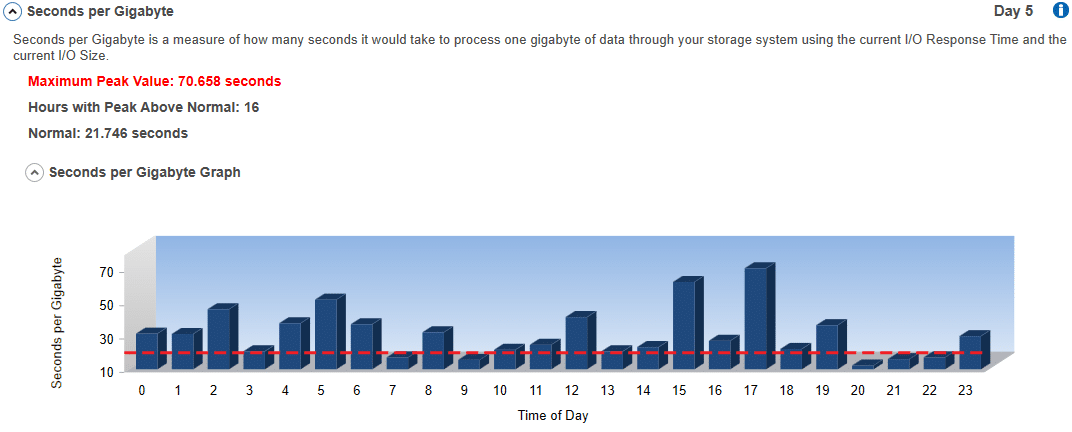
#8 Seconds per Gigabyte:
This is a measure of how many seconds it would take to process one gigabyte of data through your storage system using the current I/O Response Time and the current I/O Size. Effectively, this tool calculates the number of potential operations per second at the current I/O Response Time rate. It then divides one gigabyte by the product of potential operations per second times the I/O Size. This can vary widely based on I/O contention, size of I/Os, and several other factors. The lower the value, the better the storage performance.
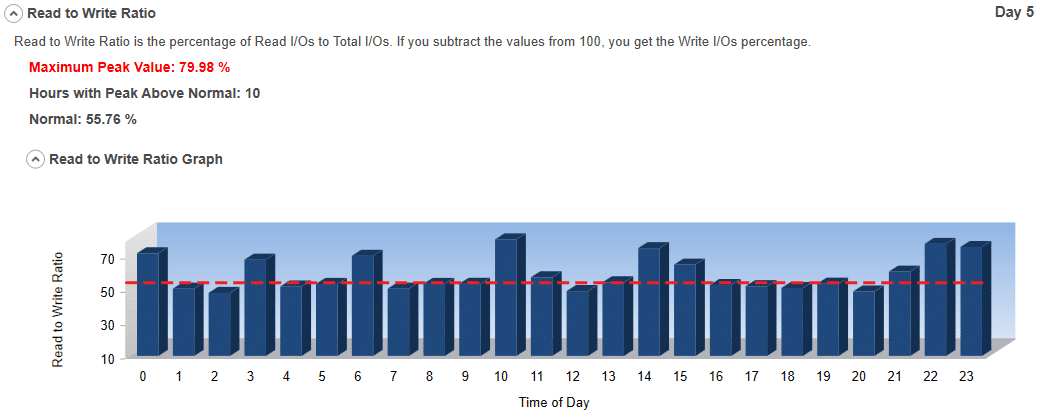
#9 Reads to Writes Ratio:
This is the ratio of reads to writes as a percentage. If you had 5,000 total I/Os and 3,456 were Read (1,544 Writes) the ratio would be 69.12%. It shows the workload characteristics of the environment. In other words, it shows if the application is predominantly Read or Write intensive. Generally, the potential to optimize performance is greater for read intensive applications.
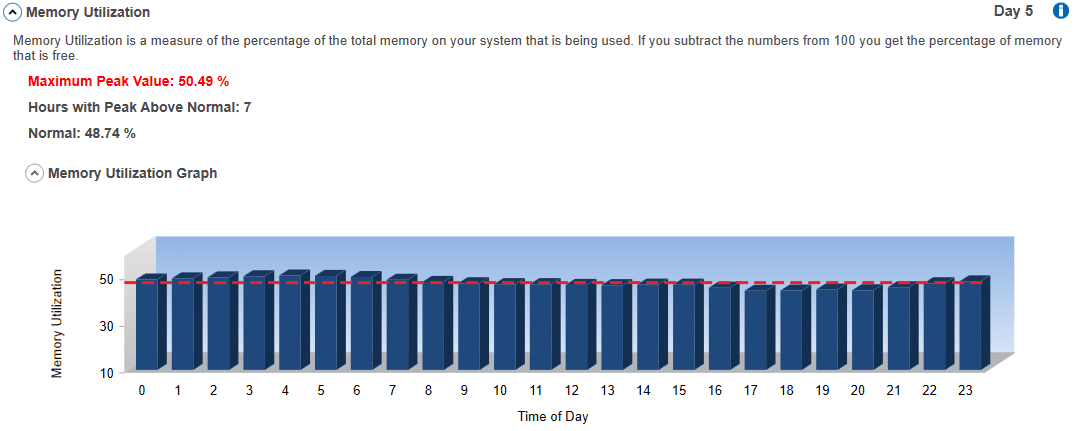
#10 Memory Utilization:
This is a measure of the percentage of memory being used by your system. Some performance problems may be caused by having limited amounts of available memory. High memory utilization may indicate that one of the bottlenecks to storage performance is inadequate memory for your systems and applications to process data. Having adequate free memory can open doors to potential optimization techniques. Sometimes just increasing the available memory on a system can make a significant difference in overall performance and storage performance specifically.
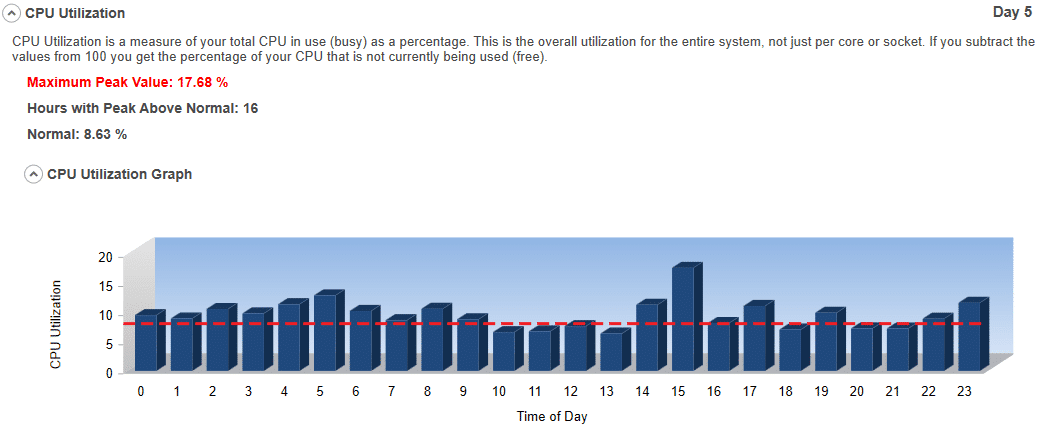
#11 CPU Utilization:
This is a measure of how busy your CPU is as a percentage. This is overall utilization for the entire system, not just per core or socket. This measure matters because if your CPU utilization is close to 100%, you probably do not have a storage-related issue.
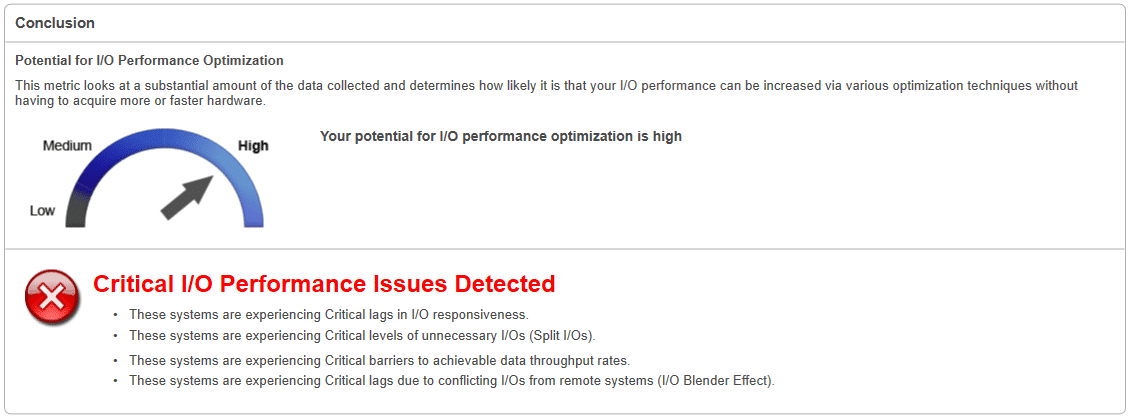
Potential for I/O Performance Optimization:
This measurement looks at a substantial amount of the data collected and determines how likely it is that your I/O performance can be increased via various optimization techniques without having to acquire more or faster hardware.
Critical, Moderate, or Minimal I/O Performance Issues will be noted.
See For Yourself if Your Servers Have an I/O Performance Problem
To find out if your servers have an I/O Performance Problem, download the FREE Condusiv I/O Assessment Tool. It’s easy:
- Download
- Install
- Choose your systems to monitor
- Choose how long to collect data
- Start Collection
- Pull up the dashboard after your data is collected and look at the results.
Originally published on Mar 12, 2020. Updated Oct 19, 2021, Aug 17, 2022.


Leave A Comment
You must be logged in to post a comment.