Okay, so you’ve bought, installed, connected, configured, and then tuned/optimized your new storage virtualization solution, but somehow there are still latencies with apps (e.g. SQL).
You’ve run the Storage Area Network (SAN) vendor utilities that:
- did not see any contention on the disks in the RAID group(s).
- noted that the average I/O to physical disks did not exceed a reasonable number of I/O’s per second on each volume in the meta device.
- checked the utilization of the port that the Host Bus Adaptor (HBA) is zoned to and did not see any performance issues.
- noted the switch port that the HBA is connected to is not saturated or reporting any errors.
And basically surmised “at this time we do not see any issue on the array or with the SAN in reference to this server.”
However….
When running PerfMon within Windows, it continues to uncover latencies in the 100ms+ range. What the hayel!
This is when it’s important to consider what those SAN optimization and reporting tools are providing. SANs can optimize storage from HBA-to-spindle. Above the HBA other factors cause latencies outside the scope or control of the SAN, and ultimately it is the App/User Experience that needs to be addressed.
So, it’s time to look further up the storage stack.
Here is a great chart (borrowed from VMware here [original link missing communities.vmware.com/docs/DOC-11812].
The chart helps simplify that SAN and even VM based latency monitoring and storage optimization do not account for latencies that may exist in the Guest Operating System (GOS). They are only aware of, and able to optimize I/O from the point they receive the traffic to the physical storage.
Monitoring performance in Windows does not go away simply because you’ve left direct attached storage (DAS) and physical servers to go virtual. There are numerous causes for poor performance on the GOS side, from poorly written apps, to incorrect configurations, to bad partitioning strategies, file system fragmentation and more. Pretty much all the issues that could cause poor Windows I/O performance on physical servers with DAS, still exist.
It’s important to continue to use GOS based solutions to determine application latency such as PerfMon, which can support counters for popular apps (like SQL).
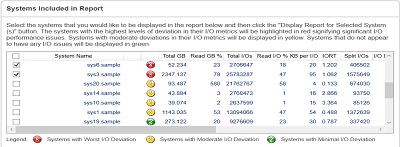
To evaluate if file fragmentation is a potential cause, track these metrics with Perfmon. Fragmentation will show up in the logical disk statistics referred to in the document. You can also use a freeware solution from Diskeeper Corporation; called Disk Performance Analyzer for Networks (DPAN) to collect file fragmentation statistics from any Windows system (physical or virtual) on your LAN/WAN. You can download DPAN here.
Sample Report:
Leave A Comment
You must be logged in to post a comment.