There are few guarantees in the IT world, but solving the toughest application performance problems in your Windows environment, while saving a bundle of cash, can be guaranteed. Let’s review how.
The Data Center View
Using some simple “whiteboard” graphics, let’s start with the Data Center view. In every Data Center, you have the same basic hardware layers. You have your compute layer, your network layer, and your storage layer. The point of having this hardware infrastructure is not just to house your data, but it’s to create a magical performance threshold to run your applications smoothly so your business can run smoothly.
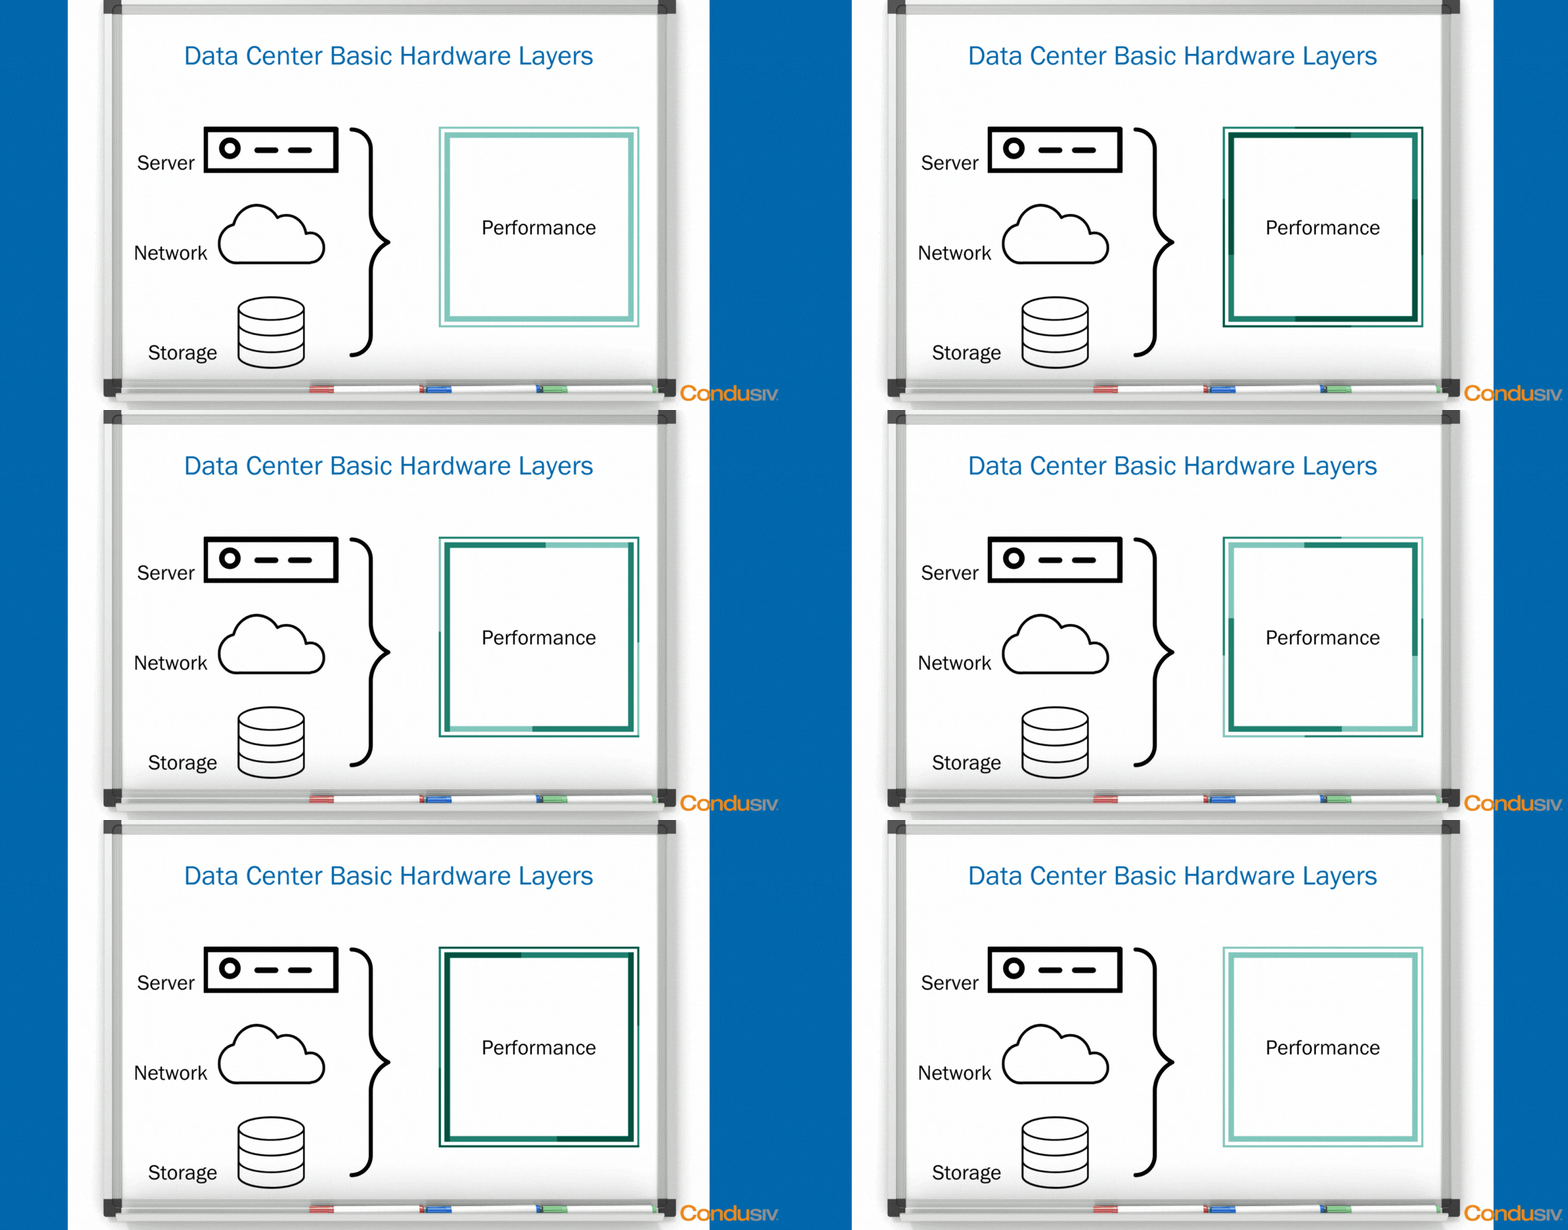
As long as your hardware doesn’t crash, and you don’t lose any data, and as long as all your applications fit nicely and neatly inside your performance boundary, well then, life is good!
The Troublesome Applications
But, in every organization, there are always, and we mean always, one or two applications that are the most harrowing in the business, that are pushing the performance boundaries and thresholds that your architecture can deliver, that simply need more performance.
We often see this as applications running on SQL or Oracle, it could be Exchange or SharePoint. We see a lot of file servers, web servers, image applications, and backups. It could be one of the acronyms: VDI, BI, CRM, ERP, you name it.
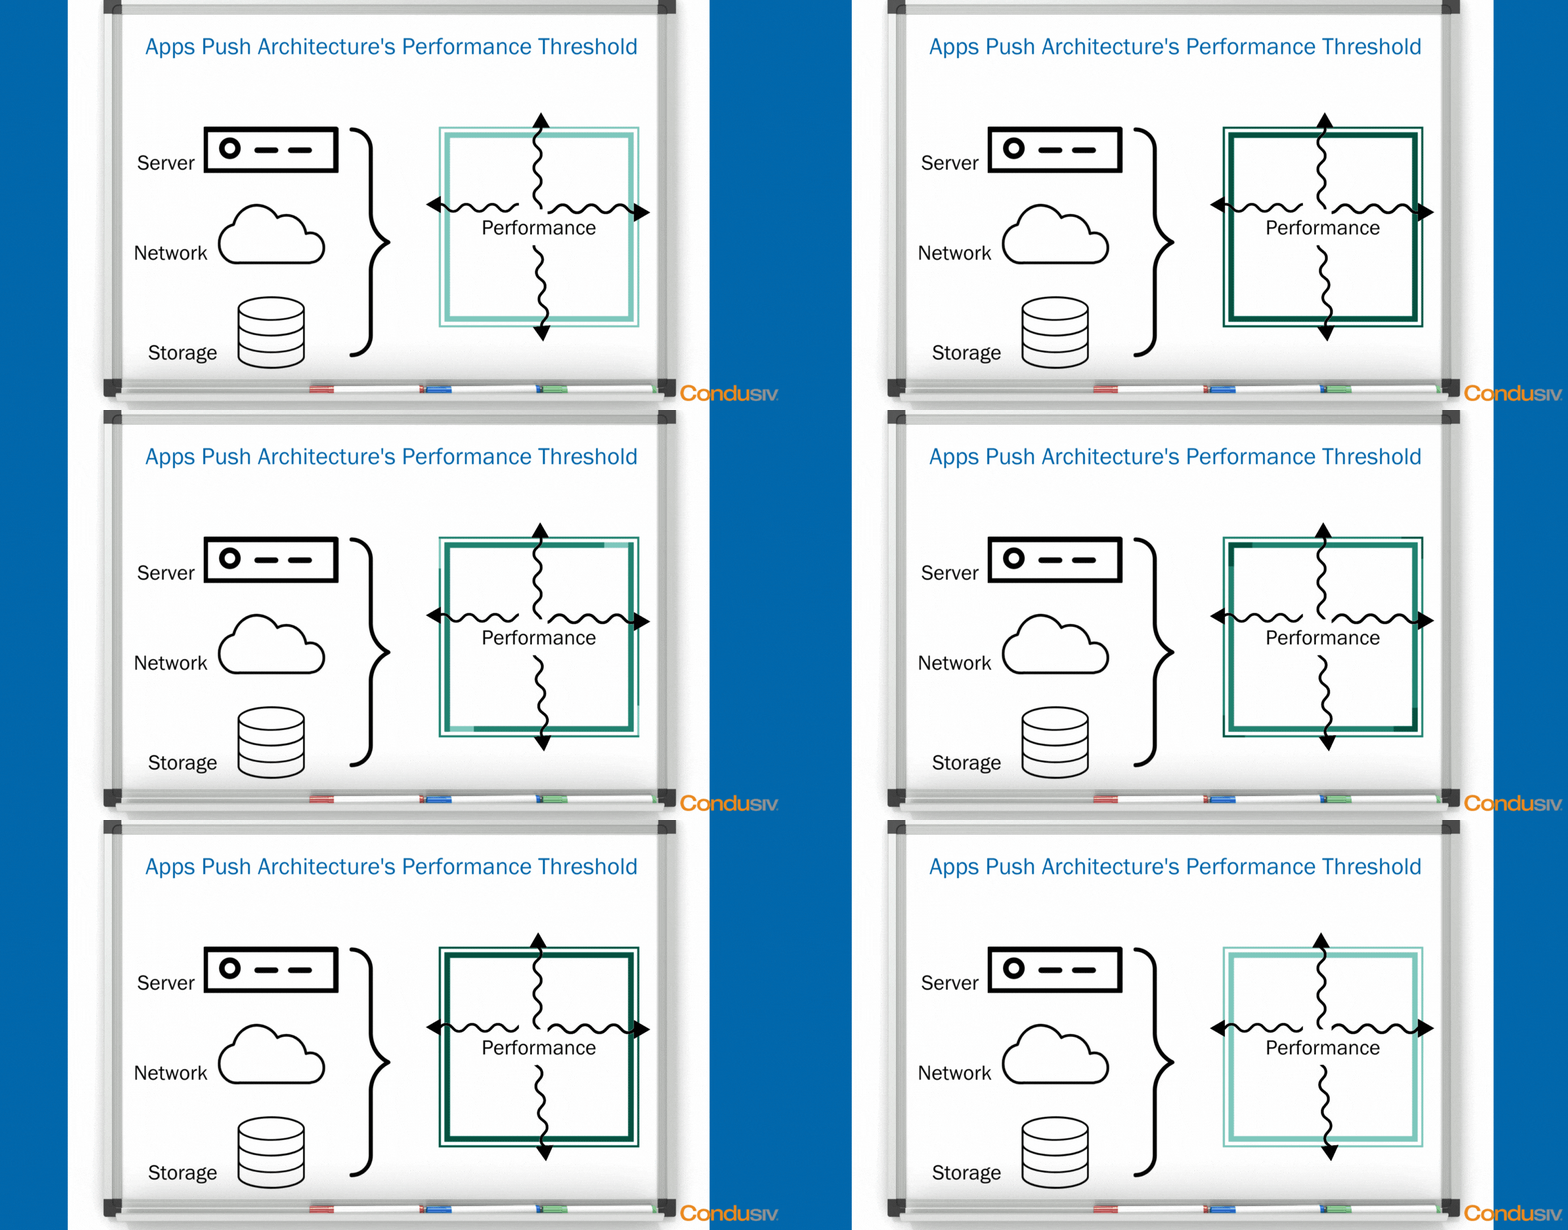
As soon as you have an application that is testing the I/O ceilings in your environment under peak load, what happens?
- applications get sluggish
- users start complaining
- back-office batch jobs start taking far too long
- backups start failing to complete in their window
- users running certain reports get frustrated
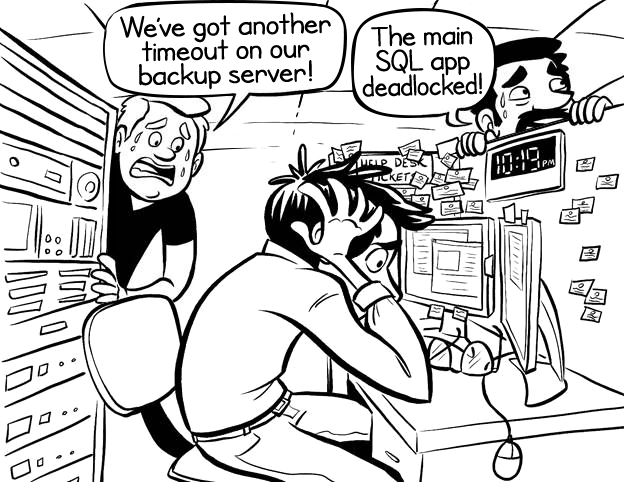
Now you’re getting all this pressure from outside of IT to jump in and solve this problem, and NOW.
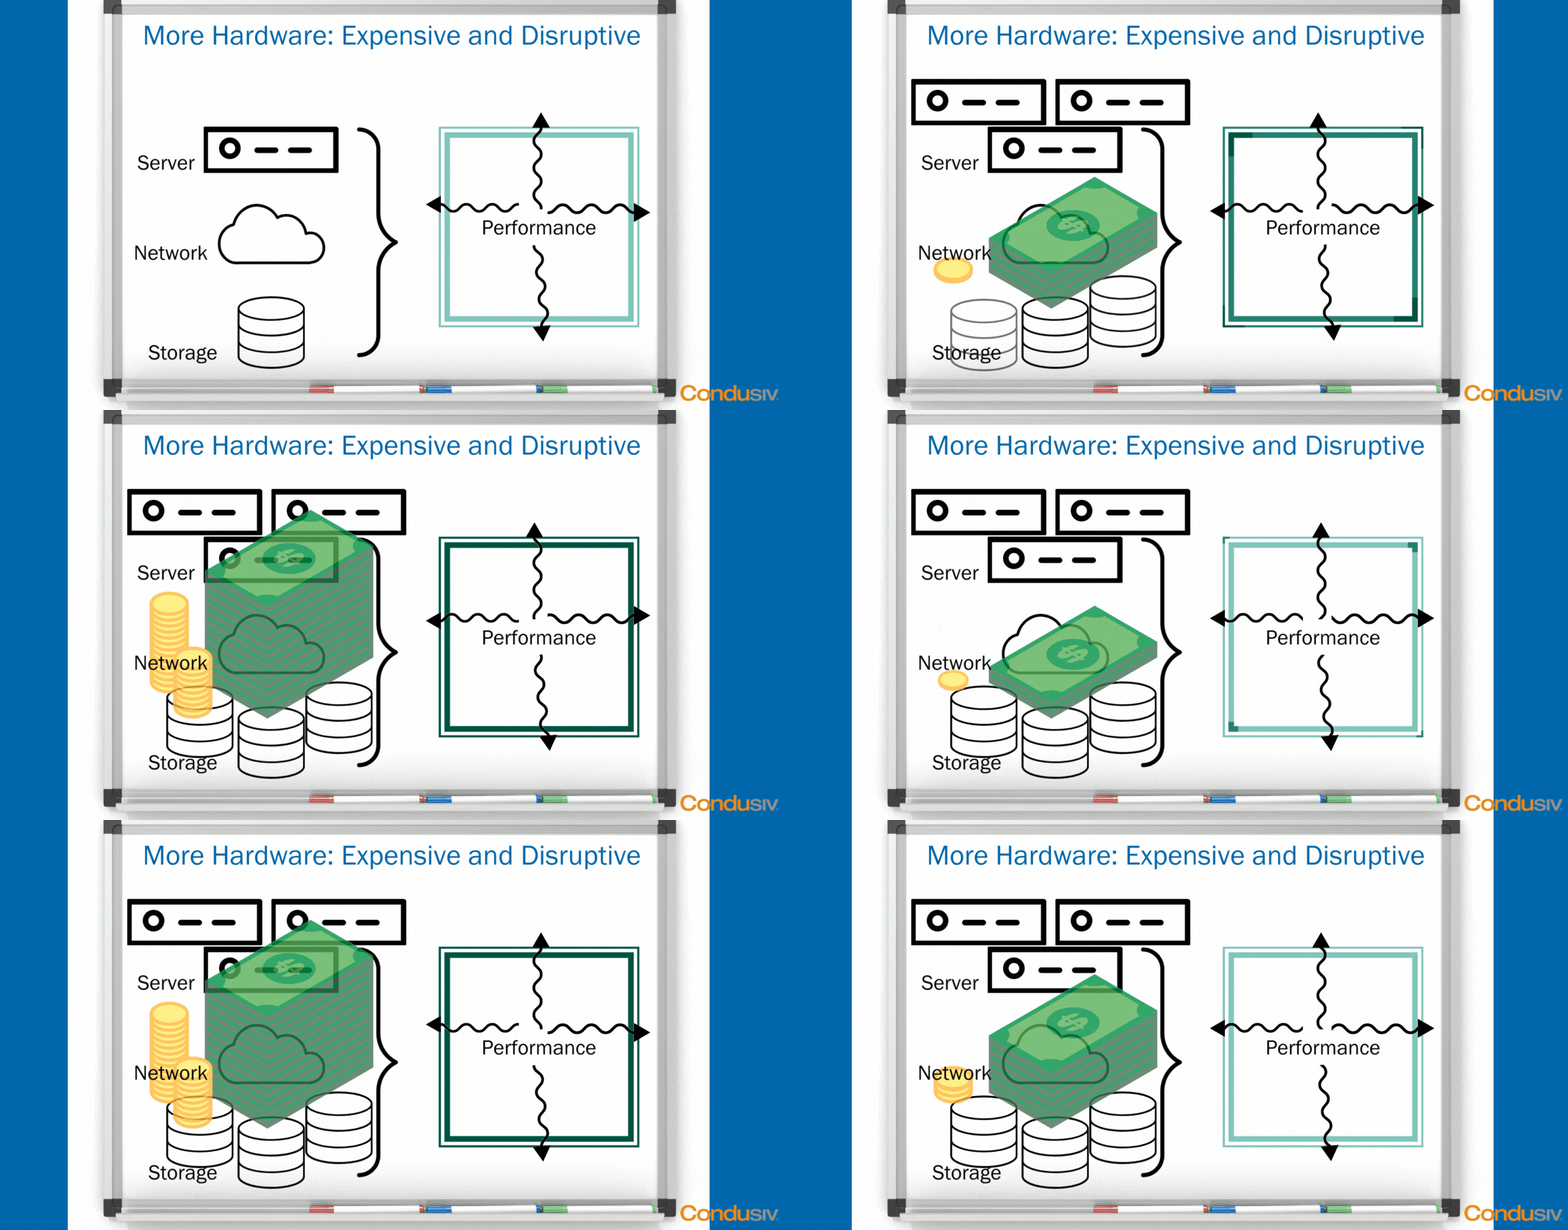
Throwing Hardware ($$$) at the Problem
Typically, what do most IT professionals at least think that they must do to boost application performance? They think they must throw more hardware at the problem to fix it. This means adding in more servers and more storage, expensive storage. Probably an All-flash array to support a particular application, or maybe a Hybrid to support another application. And ultimately this ends up being a very, very expensive, not to mention disruptive, way to solve performance problems.
Spending Less (Much less) To Solve Application Performance Problems
What if you could install some software that would magically eliminate the toughest performance problems on your existing hardware infrastructure?
We have thousands of organizations using this software-only solution, some of them the largest organizations in the world, and most of the time they’re seeing at least a 50% performance boost in application performance, but many of them see far more than that.
Our website is littered with case studies citing at least a doubling in performance. It’s the reason why Gartner named us the Cool Vendor of the year when we brought this technology to the market.
Now you may wonder, “how can a 100% software approach have this kind of impact on performance?” To understand that, we have to get under the hood of this technology stack to see the severe I/O inefficiencies that are robbing you of the performance that you paid for.
The Severe Performance-Robbing I/O Inefficiencies
As great as virtualization has been for server efficiency, the one downside is how it adds complexity to the data path. Voila, the I/O blender effect that mixes and randomizes the I/O streams from all of the disparate VMs that are sitting on the same host hypervisor. And, if that performance penalty wasn’t bad enough, up higher you have a performance penalty even worse with Windows on a VM. Windows doesn’t play well in a virtual environment, doesn’t play well in any environment where it’s abstracted from the physical layer. So, what this means is you end up with I/O characteristics that are far smaller, more fractured, and more random than they need to be. Physical systems experience similar inefficiencies also. It’s the perfect trifecta for bad storage performance.
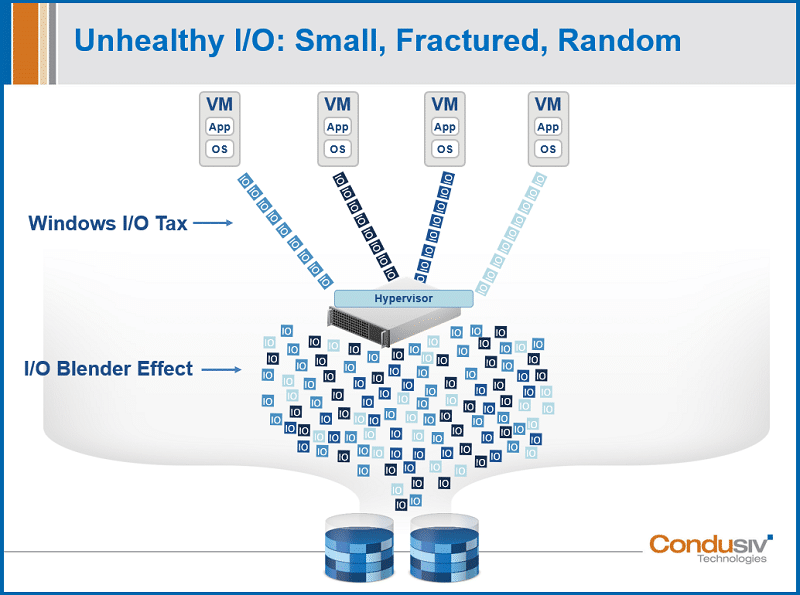
For peak application performance, you want:
- an I/O profile where you’re getting nice, clean contiguous writes and reads
- a nice healthy relationship between I/O and data
- maximum payload with every I/O operation
- sequential manner of your traffic
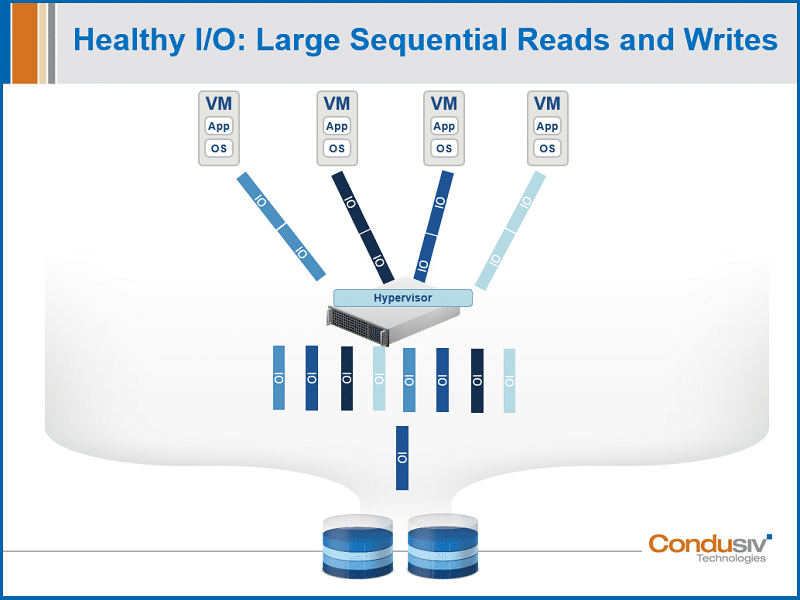
In a virtual environment running a Windows machine, this is not what you get. Instead, what you get is many small, tiny reads and writes. And all of this means that you need far more I/O than is needed to process any given workload, and it creates a death-by-a-thousand-cuts scenario. It’s like pouring molasses on your systems. Your hardware infrastructure is processing workloads about 50% slower than they should. In fact, for some of our customers, it’s far worse than that. For some of our customers, their applications barely run. And, for some, their users can barely use the application because they’re timing out so quickly from the I/O demand.
2 Patented Technologies to Restore Performance
Our patented DymaxIO™ software solves this problem, and we solve it in two ways.
The first way that we solve this problem is within the Windows file system. We add a layer of intelligence into the Windows OS where it’s just a very thin file system driver with near zero overhead. It would be difficult for you to even see the CPU footprint! DymaxIO is eliminating all the really small, tiny writes and reads that are chewing up your performance, and displacing it with nice, clean, contiguous writes and reads. So now you’re getting back to having a very healthy relationship between your I/O and data. Now you’re getting that maximum payload with every I/O operation. And the sequential nature of your traffic down to storage has dramatically improved reducing unnecessary I/O where that matters the most.

So, this engine all by itself has a huge application performance impact for our customers, but it’s not the only thing that we do.
The second thing DymaxIO does to help improve overall performance is establish a Tier-0 caching strategy using our DRAM caching engine. DymaxIO is using the idle available DRAM already committed to these VMs that is sitting there and not being used, and we’re putting that to good use. Now, the real genius behind this engine is it’s completely automatic. Nothing has to be allocated for cache. DymaxIO is aware moment by moment of how much memory is unused and only uses that portion to serve reads. You never get any kind of memory contention or resource starvation. If you have a system that’s under-provisioned and memory constrained, that engine will back off completely.
Seeing is Believing
When you consider these 2 engines: one optimizing Writes, and another optimizing Reads, you may wonder “what does this all mean”? Honestly, the best way is to simply just install the software. Try it for yourself on a virtual server or physical server and see your application performance boost. Let it run for a few days, and then pull up our built-in time-saved dashboard where you can see the amount of I/O that we’re offloading from your underlying storage device. And more importantly, see how much time that’s actually saving that individual system. Now, you might want to do a before and after stopwatch test or you might want to look at your storage UI to get a baseline of workloads before so you can see what happens, but really, all you have to do is just install the software and experience the performance and then pull up that time saved dashboard communicating the benefit that means the most to your business: time saved.
Typical Results
Now as far as typical results, this screenshot represents a median of the typical results you can expect. You see the number of I/Os that DymaxIO is removing, but take a look at the percentages right there in the top middle. You’re seeing 45% of Reads that are being served out of DRAM, meaning it’s being offloaded from going down the storage. On the right side, you’re seeing 41% of Write I/O that’s being eliminated. Now, in this typical median system, that saves over 6 days of I/O time over 90 days of testing. This I/O time saved is going to be relative to the intensity of the workload. There are some systems with our software that are saving 5.5 hours in a single day. This translates to a massive application performance boost! ASL Marketing had a SQL import batch job that was taking 27 hours. We cut it down to 12 hours! Talk about huge single-day time savings! ASL case study
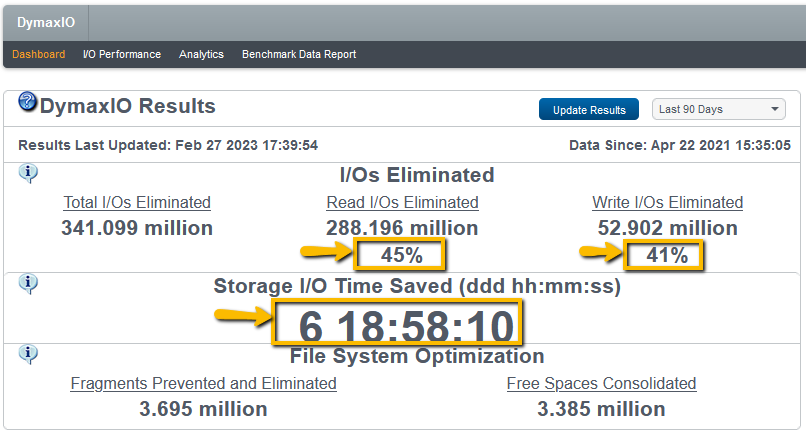
What is the sweet spot where you can get optimum performance? Well, we have found out that if a customer can maintain at least 4GB of available DRAM that our software can leverage for cache, it means give or take, but on average, you’re going to see 40% or more of Reads being served. What does that mean? It means essentially this: you have just eliminated over 40% of your Read traffic that’s gone down to your storage device, you’ve opened up all of your precious throughput from the very expensive architecture that you paid for, and you’re serving a large part of your traffic from the storage media that’s faster, more expensive than anything else, 15 times faster than an SSD sitting closer to a processor than anything else.
If you can crank up the 4GB to something even larger, you’re going to get a higher cache hit rate. A good example is the University of Illinois. Their hardest-hitting application was sitting on an Oracle database, it was supported by a very expensive All-flash array. It still wasn’t getting enough performance and so many users were accessing that system. They installed our software and saw 10X performance gains. And that’s because they were able to leverage a good amount of that DRAM and we were able to eliminate all these small, tiny reads and writes that were chewing up their performance (University of Illinois case study).
The typical results screenshot from the DymaxIO dashboard also showed 40%+ Write I/Os Eliminated. This is due to our IntelliWrite technology which dramatically reduces file fragmentation as data is written to storage. This also contributes to large performance gain while Writes are being done and that is especially significant in overcoming the I/O Blender effect. This reduction in Write I/Os also makes a significant contribution to preventing future Read I/Os since the file system will not have to do as many Split I/O operations. Split I/Os cause a single request to access a piece of data to be broken into multiple I/Os requests by the file system due to file fragmentation.
If you have a physical server, physical servers are typically over-provisioned from a memory standpoint. You have more available memory to work with, and you’ll see huge gains on a physical server.
Automatic and Transparent
All this optimization is happening automatically. It is all running transparently in the background. DymaxIO is set and forget running at near zero overhead. You may wonder, what are some typical use cases or customer examples? You can read our case studies with examples of customers where we saved them millions of dollars in new hardware upgrades, helped them extend the life and longevity of their existing hardware infrastructure, doubled performance, tripled SQL queries, cut backup times in half, you name it.
You can easily install and evaluate DymaxIO on your own on one virtual server and one physical server. However, in a virtual environment, you will see far better performance gains if you evaluate the software on all the VMs that are sitting on the same host hypervisor. This has to do with the I/O blender effect and chatty neighbor issues. So, if that’s the case, and you have more than 10 VMs on the host, you may want to contact us about getting our centralized management console that makes deployment to many servers at once easy. It’s that simple.
We look forward to helping you solve the toughest application performance problems in your Windows environment while saving you a ton of money!

Leave A Comment
You must be logged in to post a comment.